Hydraulic fracturing is a cornerstone technology for enhancing hydrocarbon recovery from unconventional and tight formations. Successful fracture treatments depend critically on understanding the real-time behavior of the fracture as it propagates through the reservoir. Among the many diagnostic tools developed for fracturing analysis, pressure data measured during fracturing remains the most accessible and valuable source of information.
Traditionally, the Nolte-Smith technique has been the industry-standard method for interpreting fracturing pressure-time data. However, despite its wide use and theoretical foundation, this method operates under assumptions and limitations that can delay or obscure critical insight about fracture growth and behavior. To address these challenges, the Moving Reference Point (MRP) technique was developed, significantly improving real-time diagnostic capability and providing a more precise, faster, and less assumption-laden approach.
This article reviews the development, theoretical basis, practical implementation, and application of the MRP technique to hydraulic fracturing pressure data interpretation. Multiple field examples and case studies are discussed to illustrate its advantages over traditional methods and its integration with advanced fracture simulators.
Background: Conventional Fracture Pressure Interpretation and Its Limitations
The conventional approach, represented primarily by the Nolte-Smith (1981) method, uses a log-log plot of net fracturing pressure (pressure above formation closure stress) versus time to categorize fracture propagation into four distinct modes. These modes represent typical fracturing behavior such as normal fracture extension, screenouts, height growth, and critical pressure behavior. While theoretically sound and validated for many treatments, this approach hinges on key assumptions:
-
Constant injection rate during fracturing.
-
Continuous and smooth fracture propagation over time.
-
Accurate knowledge of formation closure pressure to compute net pressure.
-
Use of a log-log scale which compresses data and reduces sensitivity to rapid or subtle changes.
In real life, especially with complex shale and naturally fractured formations, these assumptions frequently break down. Fracture growth often occurs intermittently, with periods of ballooning or dilation interspersed with propagation spurts. This can cause delayed detection of important events, such as screenouts or fracture height growth, because the constant initial reference time compresses the temporal resolution of changes on the log-log plot. Moreover, closure pressure is often uncertain or varies between stages, making net pressure difficult to establish precisely in real time.
The pressure-derivative technique, introduced by Ayoub et al. (1992), enhanced sensitivity by plotting the time-derivative of pressure multiplied by time on a log-log scale, sharing the slope with the original log-log plot. However, it retains the dependency on closure pressure and assumptions of smooth fracture growth, still limiting its real-time application.
The Moving Reference Point Concept: Foundational Innovation
The Moving Reference Point (MRP) technique, introduced by Pirayesh et al. (2013), was developed to overcome these limitations by fundamentally altering the reference framework used to examine fracturing pressure data. Instead of referencing all fracturing events to the initial injection time and closure pressure (fixed reference), MRP dynamically updates the reference time and pressure point when fracturing behavior changes.
This approach reflects and accommodates the observation that fractures do not grow continuously but undergo cycles of propagation, dilation (ballooning), and height growth. Each of these phases can be better identified by shifting the reference point to the onset of that phase rather than rigidly linking all data to treatment start time.
The MRP technique employs a power-law relationship linking pressure and time relative to the current reference point. From this, an exponent e describing fracturing behavior is computed continuously over time. This exponent is the central diagnostic parameter allowing classification of fracturing events:
-
indicates normal fracture extension.
-
signifies dilation due to low fracture growth rate (ballooning).
-
indicates rapid height growth or excessive fluid leak-off.
This flexible, shifting-frame analysis allows rapid detection of changes in fracturing behavior within seconds to a few minutes of their onset, compared to the tens of minutes lag encountered in the Nolte-Smith approach.
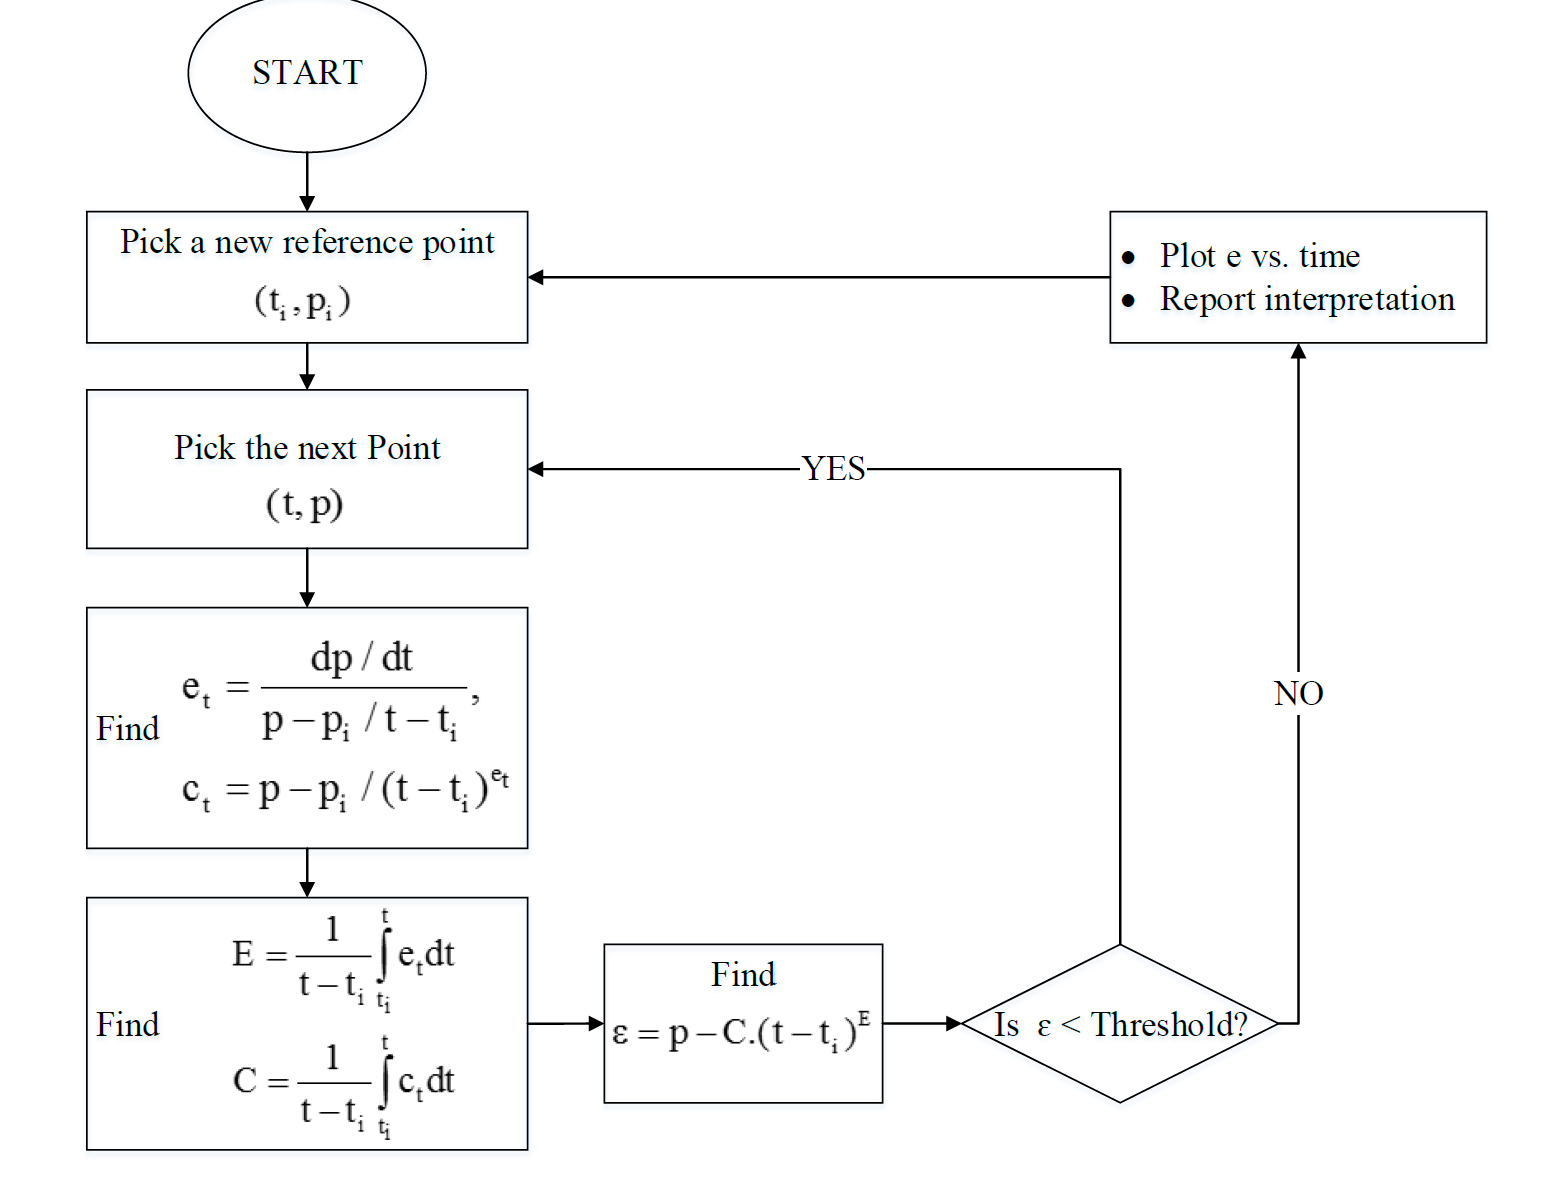
Workflow for the Moving reference point technique

Example of MRP Plot
Numerical Implementation and Workflow
The interpretation workflow begins by selecting an initial reference time and pressure point after formation breakdown or fracture reopening, omitting early noisy data. From there, the technique proceeds sequentially through time, calculating the exponent for each new point relative to the current reference.
When the mismatch between the estimated bottomhole pressure (calculated from e and other parameters) and the observed wellbore pressure exceeds a predefined threshold, the reference point is shifted to this new time and pressure, resetting the sliding window of analysis. This computationally intensive procedure requires computer programming, but yields a smooth, updated profile of e(t) over the treatment duration.
Plotting versus time on a Cartesian graph provides a visually intuitive interpretation of changing fracturing modes without data compression. Peaks and troughs on this graph correspond to ballooning, propagation, or height growth phases.
Broader Applications and Advances
Following successful initial demonstrations, MRP has been applied across diverse formations, including complex heterogenous and naturally fractured systems such as the Cotton Valley and Travis Peak sandstones in East Texas.
Studies incorporating MRP with integrated fracture simulators, like the GOHFER planar 3D model, enable:
-
Calibration of fracture treatments against detailed reservoir petrophysical and geomechanical data.
-
Comparison of fracture events detected by MRP with synthetic simulation fracture growth, height propagation, and leak-off cycles.
-
Improved understanding of fluid efficiency and fracture complexity, guiding modifications in pumping rate, fluid properties, and proppant schedules to avoid sanding out or delivery inefficiencies.
These integrated approaches extend MRP’s utility from diagnostic interpretation to a key element in decision-making workflows for optimizing hydraulic fracturing design and execution.
Recommendations for Practice
-
Use downhole pressure gauges to capture accurate, high-frequency pressure data necessary for MRP’s detailed temporal resolution.
-
Apply MRP analysis in real time during fracturing treatments to detect events early and adjust parameters—pumping rate, fluid viscosity, proppant concentration—to prevent adverse outcomes like screenouts and excessive height growth.
-
Combine MRP results with microseismic monitoring and hydraulic fracture simulation outputs to triangulate fracture geometry and propagation mode more confidently.
-
Continuously calibrate and optimize MRP numerical routines and threshold parameters for field-specific conditions and treatment types.
Conclusion
The Moving Reference Point technique revolutionizes hydraulic fracturing pressure interpretation by introducing a dynamic frame of reference aligned with fracture growth phases. This method addresses key limitations of traditional log-log methods by improving temporal resolution, eliminating dependency on closure pressure knowledge, and accommodating complex, intermittent fracture behavior.
Validated through multiple field cases and enhanced by integration with sophisticated simulation models, MRP supports real-time decision-making that improves treatment efficiency and well performance. As real-time monitoring and digital oilfield capabilities grow, MRP stands as an essential tool for smarter, more adaptive hydraulic fracturing operations.
You can now uplaod your treating pressure and get MRP Curve for your job using the following tool:
You will need time of the pumping period in minutes , downhole (prefered) or surface treating pressure and date/time column for the job during pumping