Archive for the ‘News’ Category

New Wavelet-Based Method for Mapping Inter-Well Connectivity in Waterflooded Reservoirs

Posted on: May 20th, 2026 by Mohamed Abdelsalam

Waterflooding is one of the most important recovery methods in mature oil fields. By injecting water into the reservoir, operators can maintain pressure and push oil toward producing wells. However, one major question always controls the success of waterflooding:

Which injector is really communicating with which producer?

A recent paper by Mohamed Adel Gabry, Amr Ramadan, and Mohamed Y. Soliman, titled “Inter-Well Connectivity Estimation Using Continuous Wavelet Transform: A Novel Approach,” introduces a new answer to this question using routine injection and production data. The paper presents a Cross-Wavelet Transform Coherence, or CrWTC, workflow to estimate inter-well connectivity in waterflooded reservoirs.


Why This Study Matters

In waterflood management, understanding inter-well connectivity helps engineers answer practical questions such as:

  • Which producers are strongly affected by each injector?
  • Are there high-permeability streaks or preferential flow paths?
  • Are some producers isolated by faults or barriers?
  • Is injected water moving toward the desired part of the reservoir?
  • Can injection be adjusted to improve sweep efficiency?
  • Can water breakthrough be predicted or explained?

Traditional methods such as reservoir simulation and the Capacitance–Resistance Model, or CRM, are useful, but they have limitations. Full reservoir simulation can be slow, expensive, and highly dependent on geological-model quality. CRM is faster, but it uses simplifying assumptions and may struggle when the reservoir response is nonlinear, nonstationary, or strongly affected by heterogeneity.

This paper introduces a faster and more dynamic alternative based on wavelet signal processing.


Main Idea of the Paper

The paper treats the reservoir as a dynamic system:

  • Injector rate = input signal
  • Producer liquid rate = output signal
  • Connectivity = how strongly the producer response follows the injector behavior

Instead of using simple correlation between injection and production rates, the method uses Continuous Wavelet Transform, or CWT, to analyze the signals in both time and frequency.

This is important because reservoir behavior changes with time. A producer may be weakly connected to an injector early in the waterflood but become more connected later as the waterfront advances.

The proposed method can capture this changing behavior.


What Is New in This Work?

The novelty of the paper can be summarized clearly:

  • It applies Cross-Wavelet Transform Coherence to injector and producer rate data.
  • It uses the complex Morlet wavelet, which captures both amplitude and phase relationships.
  • It provides a continuous time–frequency connectivity map, not just one static correlation number.
  • It can be updated as new field data become available.
  • It helps track connectivity evolution and waterfront movement during waterflooding.
  • It was tested on both simple synthetic cases and more realistic reservoir datasets.
  • It was benchmarked using the Volve sandstone field dataset and the COSTA carbonate reservoir model.

Why Wavelets Are Useful Here

Production and injection data are not always simple. They may include:

  • Shut-ins
  • Rate changes
  • Delayed pressure support
  • Water breakthrough
  • Operational noise
  • Nonlinear reservoir response
  • Time-varying connectivity

A normal time plot may not reveal these relationships clearly.

Wavelet analysis works like a mathematical microscope. It can show when two signals behave similarly and at what time scale this relationship appears.

In this paper, the CrWTC value ranges from 0 to 1:

  • 0 means weak or no coherence.
  • 1 means strong coherence.
  • Higher coherence means stronger relative injector–producer communication.

However, the authors emphasize that CrWTC should mainly be used to rank producers connected to the same injector, not to compare absolute values across different injectors. This is because each coherence value is normalized by the energy content of the specific injector and producer signals.


How the Workflow Works

The workflow can be explained in simple steps:

  1. Collect injection-rate data from injector wells.
  2. Collect liquid production-rate data from producer wells.
  3. Synchronize the time series on a common time grid.
  4. Remove invalid long gaps and avoid artificial coherence from missing data.
  5. Apply CWT to each injector and producer signal.
  6. Calculate CrWTC for every injector–producer pair.
  7. Rank producer responses for each injector.
  8. Compare the results with simulation, CRM, geological interpretation, or water saturation maps.
  9. Update the analysis when new production and injection data become available.

This makes the method practical for reservoir surveillance.


Validation Cases Used in the Paper

The study did not rely on one example only. It tested the method at different levels of reservoir complexity.

1. Simple Synthetic Reservoir Model

The first test used one injector and four producers placed in areas with different permeability values.

The goal was simple:

  • Check whether CrWTC can identify the producers that are more strongly connected to the injector.
  • Compare the ranking with known permeability distribution.
  • Validate the method against reservoir simulation.

The CrWTC method successfully ranked the connectivity between injector and producers in agreement with the expected reservoir behavior and with CRM results.

2. High-Permeability Streak Case

The second test used a synthetic reservoir with high-permeability streaks.

This is important because high-permeability streaks can create preferential flow paths. In waterfloods, these paths may cause injected water to move quickly toward certain producers, resulting in early water breakthrough and poor sweep efficiency.

The method was tested to see whether it could detect these preferential connections from rate data.

3. PyWaterflood CRM Benchmark

The paper also compared the CrWTC results with examples from the PyWaterflood CRM framework.

This comparison was useful because CRM is a common reduced-order method for estimating injector–producer connectivity. By comparing CrWTC with CRM, the authors showed how the new wavelet-based method performs relative to an established connectivity tool.

4. Volve Sandstone Field Dataset

The Volve field case is one of the strongest parts of the paper because it uses real field data.

The Volve field includes:

  • Two injector wells
  • Five producer wells
  • Around nine years of waterflooding history
  • A history-matched reservoir simulation model
  • Complex operational behavior, including shutdowns

The paper showed that CrWTC results agreed with the field behavior and simulation interpretation.

Important observations included:

  • Strong connectivity between I-F-5 and P-F-14
  • Strong connectivity between I-F-4 and P-F-12
  • Lower connectivity for P-F-15D and P-F-11
  • Reduced communication toward P-F-1C
  • Connectivity trends consistent with water saturation movement in the simulation model

The history-matched simulation showed the waterfront moving mainly toward the northwest, and the CrWTC results reflected this movement.

5. COSTA Carbonate Reservoir Model

The COSTA model was used to test the method in a more complex carbonate reservoir system.

This is important because carbonate reservoirs often have:

  • Strong heterogeneity
  • Layered flow units
  • Complex depositional architecture
  • Large permeability contrasts
  • Complicated sweep behavior

Using both Volve and COSTA helped demonstrate that the method can be applied to different reservoir types, not only simple sandstone systems.


Main Technical Contribution

The main contribution of the paper is not simply applying wavelets to production data. The real contribution is using wavelet coherence to map dynamic injector–producer communication.

This is different from older wavelet-based connectivity methods because:

  • Older methods often used Discrete Wavelet Transform, or DWT.
  • DWT analyzes signals only at fixed decomposition levels.
  • Older methods often used cross-correlation, which assumes more linear behavior.
  • The new method uses continuous wavelet coherence, which gives a smoother and more complete time–frequency view.
  • The result is normalized between 0 and 1, making it easier to interpret as relative synchrony.

This allows the method to detect both amplitude and phase relationships between injector and producer signals.


Practical Benefits for Reservoir Engineers

This method can help reservoir engineers in several ways:

  • Quickly screen injector–producer relationships.
  • Identify dominant flow paths.
  • Detect weakly connected producers.
  • Support injection reallocation decisions.
  • Track waterfront movement over time.
  • Compare dynamic connectivity with geological interpretation.
  • Complement CRM and reservoir simulation.
  • Reduce dependence on expensive full-field simulation for early diagnostic work.
  • Update connectivity maps as new data become available.

The method is especially attractive because it uses data that operators usually already have: injection and production rates.


Important Interpretation Note

CrWTC values should be interpreted carefully.

The paper makes an important point:

  • CrWTC is best used to compare producers around the same injector.
  • It should not be used as a universal absolute connectivity number across all injectors.
  • For example, a CrWTC value of 0.8 for one injector–producer pair does not necessarily mean the same physical connectivity as 0.8 for another injector with a different injection history.

So the best practical use is:

For each injector, rank the producers from strongest to weakest response.

This ranking can then guide reservoir-management decisions.


Why This Paper Is Important ?

This work fits strongly within the research direction of using advanced signal processing and data analytics for petroleum engineering.

It shows that ordinary field data can contain hidden reservoir information when analyzed with the right mathematical tools. Instead of relying only on static maps, simple correlations, or full simulation, the CrWTC method provides a dynamic way to see how wells communicate through time.

The paper also connects several important research areas:

  • Waterflood optimization
  • Reservoir surveillance
  • Inter-well connectivity
  • Wavelet transform
  • Time–frequency signal analysis
  • Data-driven reservoir management
  • Field-scale validation

Key Takeaway

This paper presents a clear and practical message:

Cross-Wavelet Transform Coherence can turn routine injection and production data into dynamic inter-well connectivity maps.

By using CWT with a complex Morlet wavelet, the method can identify how injector–producer communication changes with time, detect dominant flow paths, and support better waterflood management. The validation using synthetic models, CRM comparison, Volve field data, and the COSTA carbonate model demonstrates that the approach is promising for both research and field applications.

Impact of Relative Stress Magnitudes and Well Orientation on Well Productivity Across Major U.S. Shale Plays

Posted on: February 8th, 2026 by Mohamed Abdelsalam

Introduction

Unconventional reservoir productivity is governed by a complex interaction of geomechanical, geological, and operational factors. Among these, the orientation of horizontal wells relative to the in-situ stress field plays a decisive role in controlling hydraulic fracture propagation, fracture conductivity, and ultimately hydrocarbon recovery. Modern shale developments increasingly rely on stress characterization to optimize well trajectories and stimulation design.

The study titled Impact of Relative Stress Magnitudes and Well Orientation on Well Productivity Across Major U.S. Shale Plays: A Regional Data Analysis Study evaluates this relationship using a large-scale, data-driven approach integrating geomechanical stress mapping with production performance across North America’s major unconventional basins.

Leveraging more than 128,000 horizontal wells, the work provides one of the most comprehensive basin-scale validations of how stress anisotropy and faulting regimes influence well productivity trends.

Geomechanical Framework

Stress Orientation and Faulting Regimes

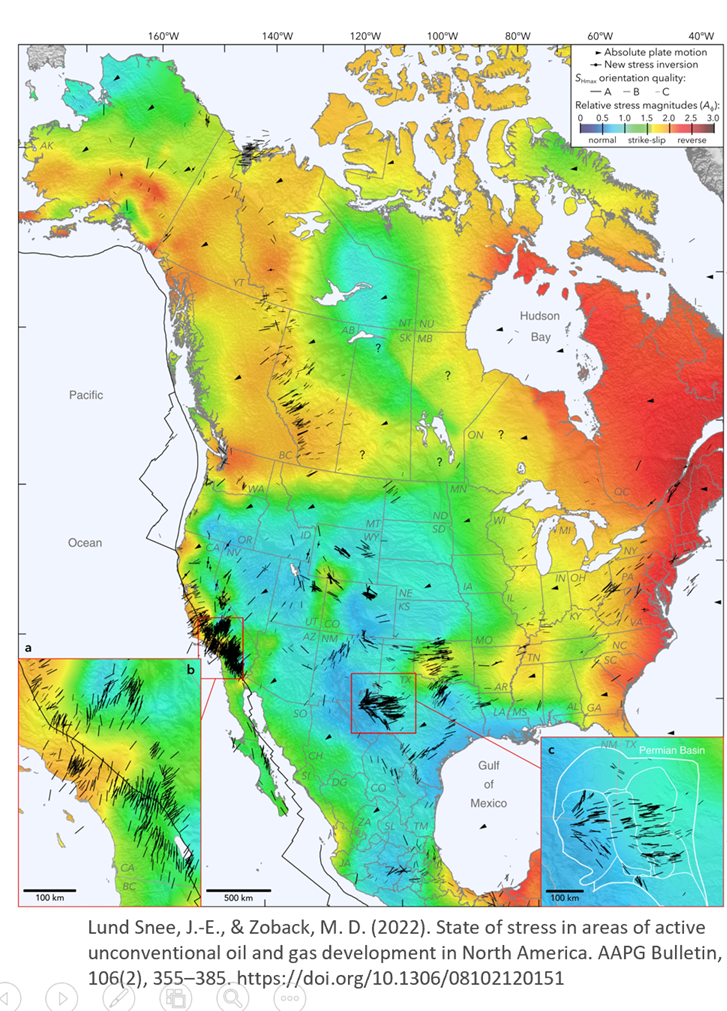
The analysis builds upon the regional stress model developed by Lund Snee and Zoback (2022), which mapped North America’s present-day stress state using thousands of stress indicators derived from:

  • Borehole breakouts

  • Drilling-induced fractures

  • Image logs

  • Leak-off tests

  • Mini-frac data

  • Focal mechanisms 

These datasets enabled the determination of:

  • Maximum horizontal stress (SHmax)

  • Minimum horizontal stress (Shmin)

  • Vertical stress (Sv)

  • Faulting regime (normal, strike-slip, reverse)

The continental stress map (see figure on p.3) illustrates coherent SHmax orientations across basins, with localized rotations near structural boundaries and mechanical contrasts.

Stress Anisotropy Index (ANI)

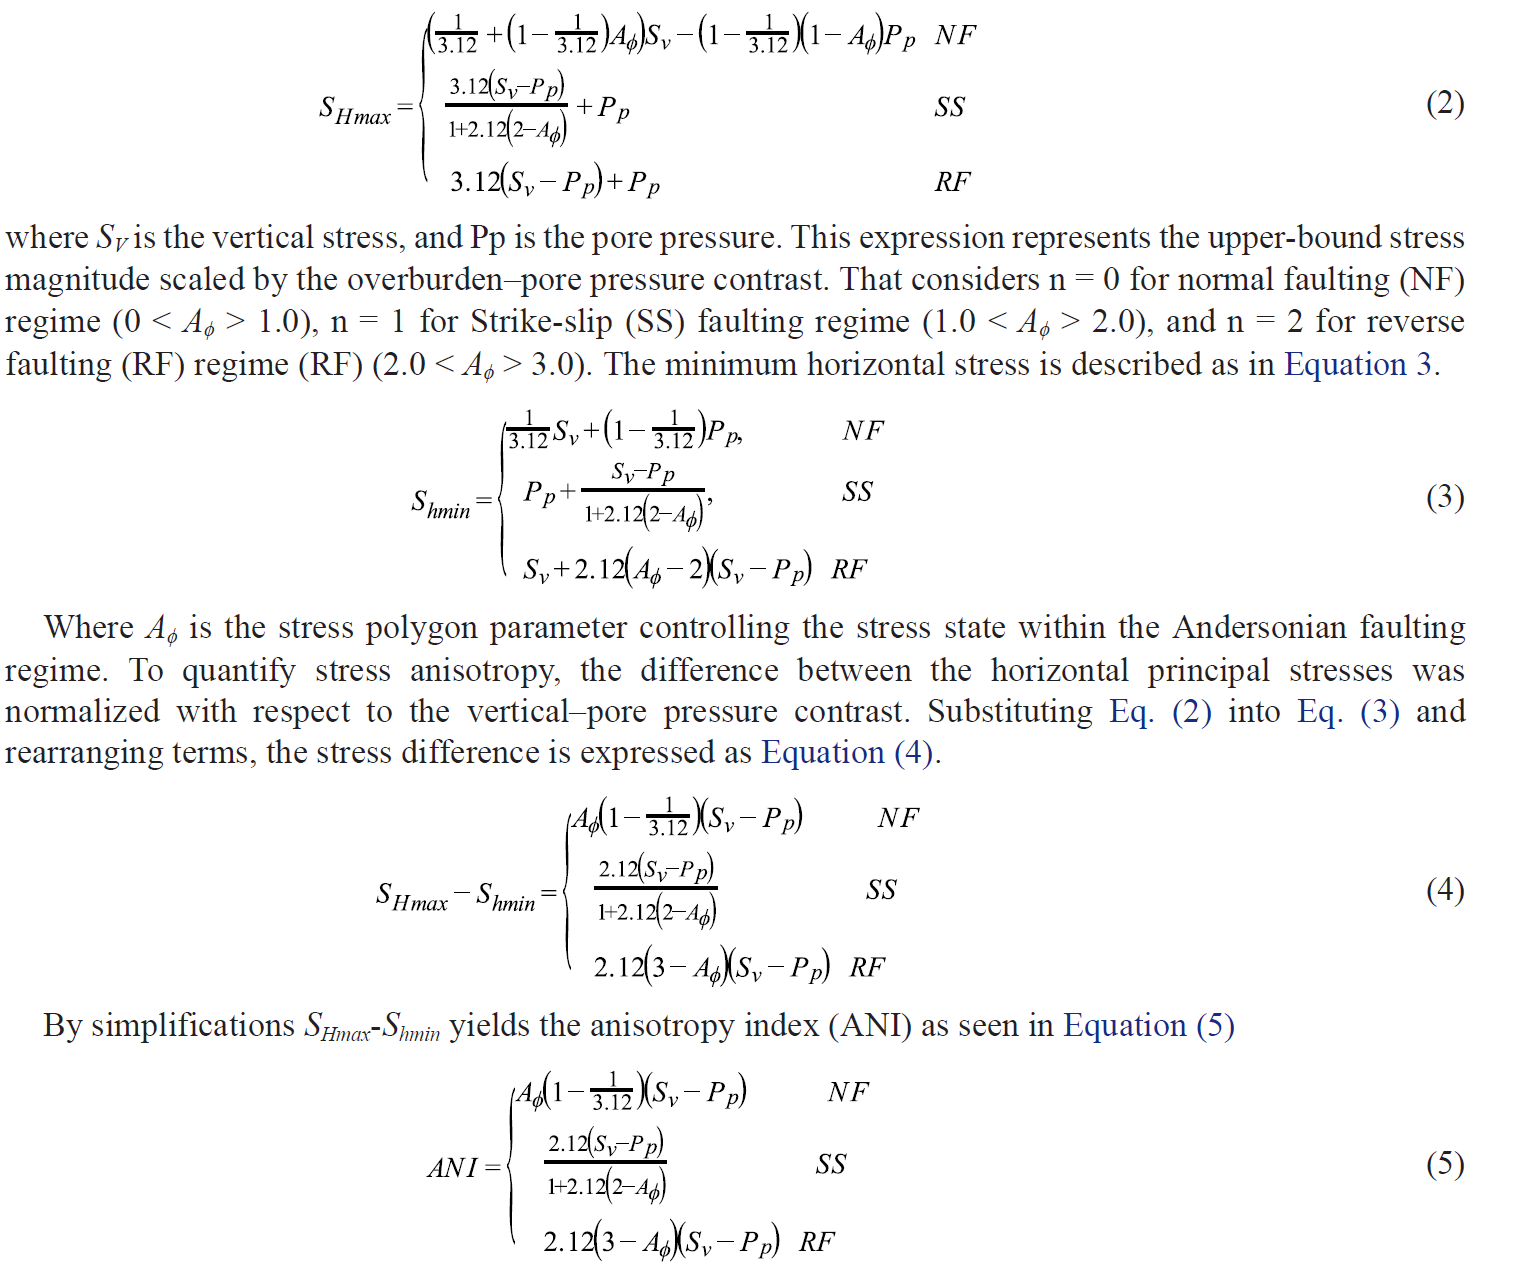
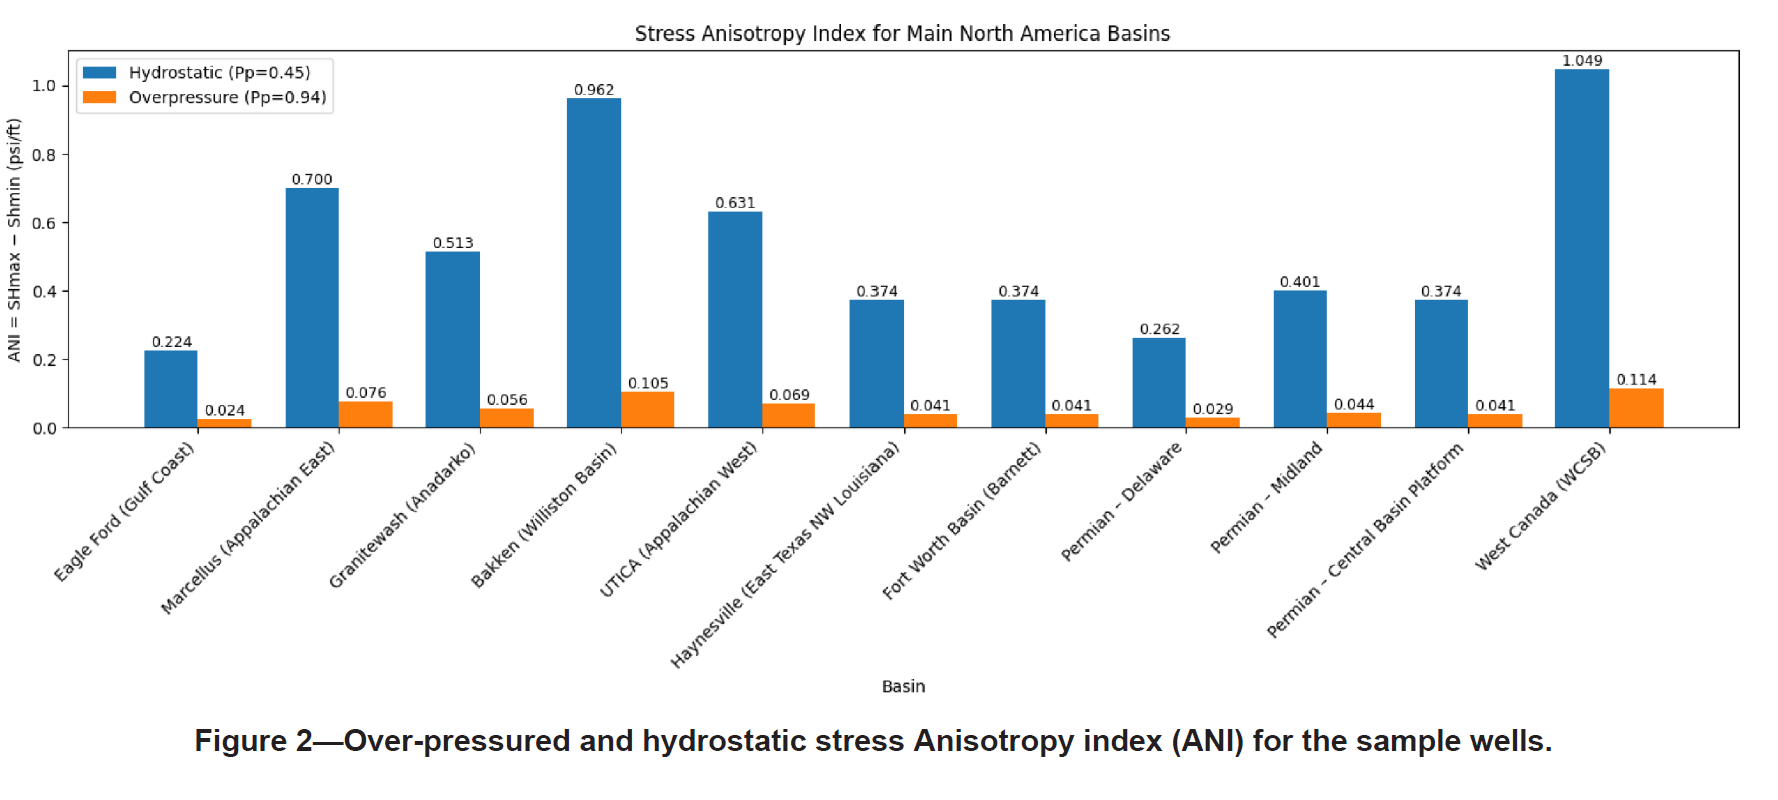
To quantify differential stress intensity, the study formulated the Stress Anisotropy Index (ANI), derived from the difference between SHmax and Shmin normalized by the vertical–pore pressure contrast. 

Key controlling parameters include:

  • Vertical stress gradient (~1.0–1.1 psi/ft)

  • Pore pressure gradient (0.45–0.94 psi/ft)

  • Faulting parameter (Aφ)

ANI serves as a predictive indicator of fracture directionality and well orientation sensitivity.

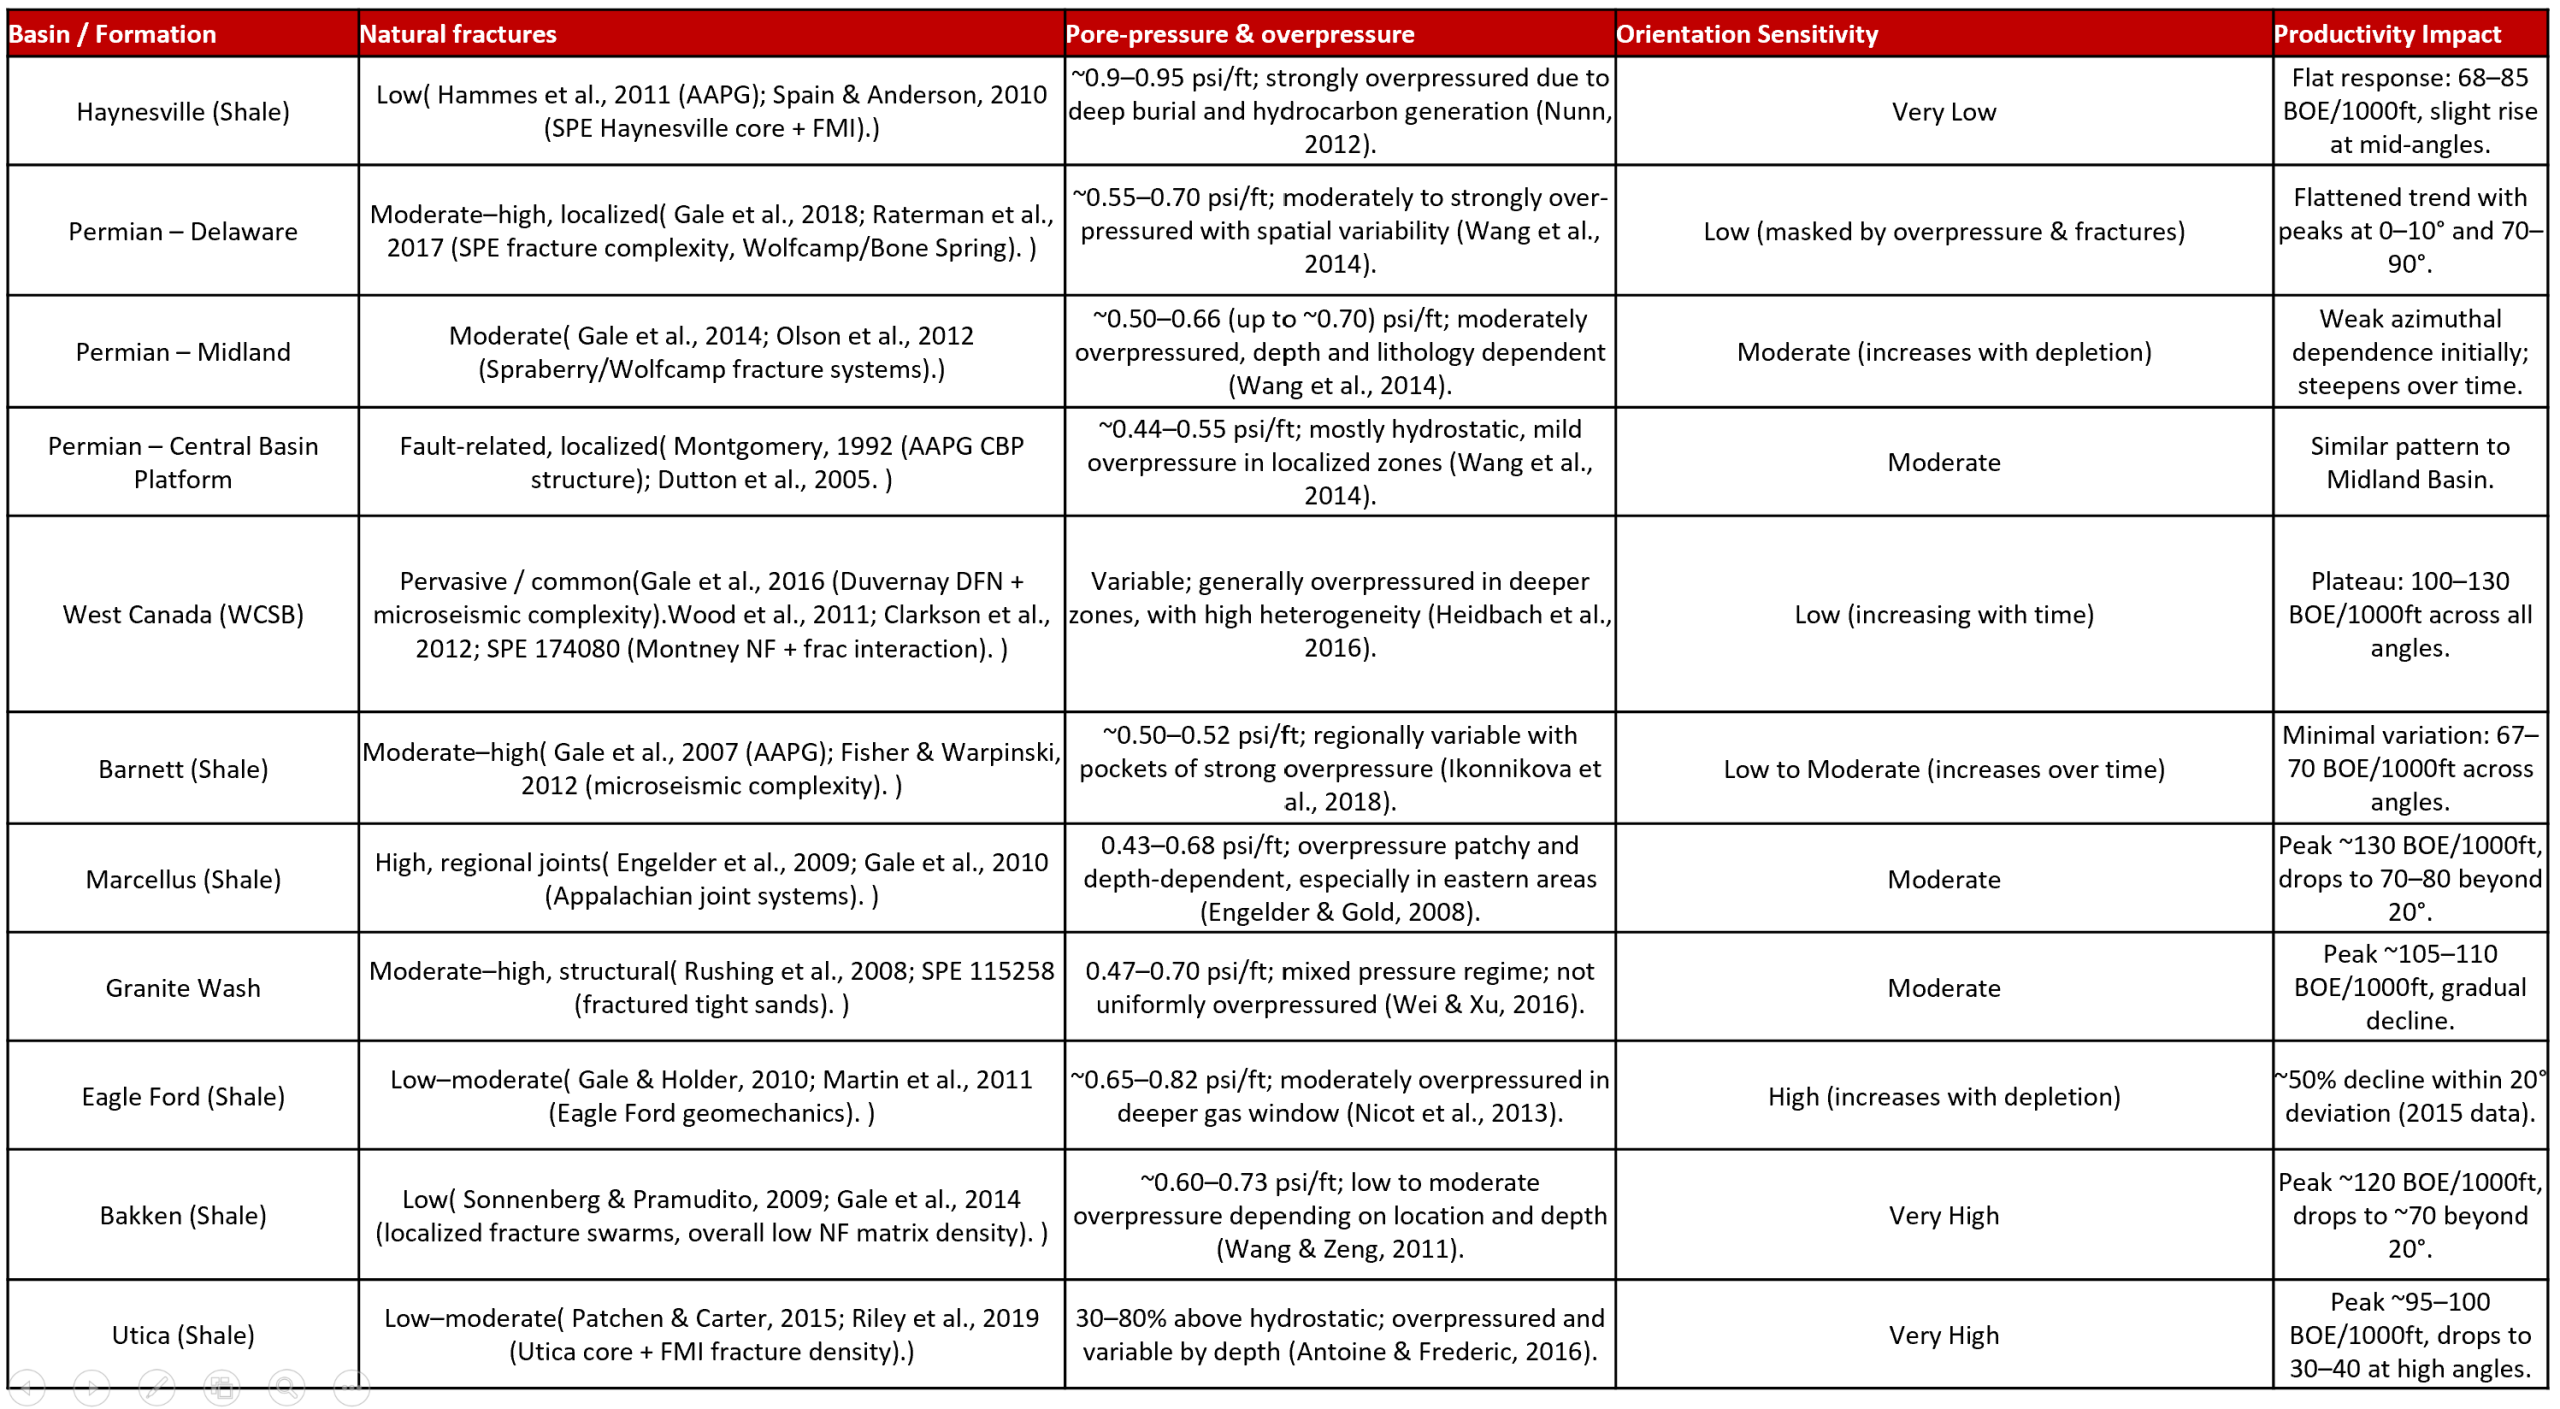
Matching Geology to Production


Methodology

Dataset Construction

The productivity analysis incorporated wells from major unconventional plays, including:

  • Permian Basin

  • Bakken

  • Eagle Ford

  • Marcellus

  • Utica

  • Barnett

  • Haynesville

  • Granite Wash

  • Western Canada

Well orientation was calculated from directional surveys, and stress orientation was obtained from the World Stress Map database.

Productivity Normalization

To ensure fair basin comparisons, productivity was normalized using:

  • 36-month cumulative production

  • Lateral length scaling

  • Proppant intensity normalization 

Wells were grouped into 90 bins based on proppant loading and lateral length to maintain statistical rigor.

The angular deviation parameter (θ) measured the angle between well azimuth and Shmin.

Basin-Scale Results

This large-scale integration of geomechanics and production analytics advances unconventional reservoir engineering from empirical design toward physics-informed optimization.

By quantifying how stress anisotropy, pore pressure, and tectonic regime interact, the study establishes a predictive framework for maximizing productivity across diverse shale systems.

Utah FORGE: A Decade of Innovation Advancing Enhanced Geothermal Systems

Posted on: February 2nd, 2026 by Mohamed Abdelsalam

Enhanced Geothermal Systems (EGS) are widely recognized as one of the most promising pathways toward scalable, baseload renewable energy. Yet, their deployment has long been constrained by subsurface uncertainty, fracture controllability, and induced seismicity concerns.

In a newly published comprehensive review, Amr Ramadan and Fracwave research team at the University of Houston, in collaboration with the University of Utah, present the most detailed field-scale synthesis to date of the Utah Frontier Observatory for Research in Geothermal Energy (FORGE)—the world’s leading dedicated EGS field laboratory .

This paper marks Part 1 of a two-part review series, capturing nearly a decade of innovation (2017–2025) and offering a definitive reference for researchers, engineers, and decision-makers working to commercialize EGS technology.

Why Utah FORGE Matters

Unlike conventional geothermal systems—which are geographically limited to naturally permeable, hydrothermal reservoirs—EGS unlocks geothermal energy almost anywhere by engineering permeability in hot, low-permeability rock. Utah FORGE was established by the U.S. Department of Energy to address the fundamental scientific and engineering barriers preventing EGS from reaching commercial maturity.

This review documents how Utah FORGE has evolved into a full-scale subsurface laboratory, operating in crystalline granite at temperatures exceeding 200 °C and depths approaching 3 km, with an unprecedented level of instrumentation, data transparency, and experimental control.


What This Paper Delivers

Authored by Amr Ramadan, Mohamed A. Gabry, Mohamed Y. Soliman, and John McLennan, the paper provides a field-centered, data-driven synthesis of Utah FORGE achievements, including:

🔹 Reservoir Creation in Crystalline Granite

  • Demonstrated hydraulic connectivity between highly deviated wells separated vertically by ~300 ft

  • Successful multi-stage hydraulic stimulations in ultra-low-permeability basement rock

  • Sustained circulation tests at injection rates of ~10 bpm

🔹 Advanced Fracture and Stress Characterization

  • High-resolution fracture mapping using FMI and ultrasonic image logs

  • Robust in-situ stress determination showing a normal-faulting regime with NNE–SSW maximum horizontal stress

  • Identification of near-wellbore tortuosity effects driving treating pressures above 10,000 psi

🔹 World-Class Monitoring and Diagnostics

  • Integrated DAS, DTS, and microseismic arrays achieving meter-scale spatial resolution and kHz-level temporal sampling

  • Detailed analysis of seismic and aseismic deformation during stimulation and circulation

  • Clear evidence of decoupling between seismicity and conductive fluid flow—reshaping how EGS performance is interpreted

🔹 Open Science and Data Infrastructure

  • Over 300 curated datasets (>133 TB) released to the public

  • A reproducible research ecosystem supporting advanced analytics, numerical modeling, and machine learning

  • Early deployment of AI and Small Language Models trained directly on Utah FORGE data


Beyond a Case Study: A Global EGS Blueprint

Rather than presenting isolated results, this paper frames Utah FORGE as a transferable template for EGS development worldwide. The lessons documented here—on stimulation design, fracture complexity, stress heterogeneity, monitoring strategy, and data integration—are directly applicable to future geothermal projects in crystalline basement settings across the globe.

Importantly, the authors highlight remaining challenges, including:

  • Long-term thermal sustainability

  • Fracture network optimization

  • Proppant transport at extreme temperatures

  • Coupled thermo-hydro-mechanical modeling for lifetime prediction

These topics will be addressed in Part 2 of the review, which will focus on circulation performance and thermal drawdown behavior.


A Milestone Contribution from Our Research Group

This publication reflects a combining deep field experience, advanced diagnostics, and data-driven modeling. It stands as one of the most authoritative EGS references published to date and reinforces Utah FORGE’s role as the global benchmark for engineered geothermal systems.

📌 If you work in geothermal energy, subsurface engineering, hydraulic stimulation, or energy transition technologies—this paper is essential reading.

Check the paper

https://www.mdpi.com/2227-9717/14/3/512

and the data

https://forge.amramadan.com/

Fracwave Research Group at HFTC 2026!

Posted on: January 25th, 2026 by Mohamed Abdelsalam

We are thrilled to share that members of the Fracwave research group will be presenting cutting-edge research at the upcoming 2026 SPE Hydraulic Fracturing Technology Conference and Exhibition (HFTC), taking place February 3–5, 2026 at the Waterway Marriott Hotel & Convention Center, The Woodlands, Texas, USA.

This premier industry event brings together leading experts, scientists, and practitioners to explore advances in hydraulic fracturing technology and geomechanics.


📅 Presentations by Fracwave Researchers


1. Son Nguyen — Wed, February 4, 2026

Session: Frac Forward: Innovations in Stimulation Engineering
Time: 2:00 PM – 3:35 PM CST
Location: Waterway Ballroom 1-4
Session Focus: Innovative stimulation technologies that push the boundaries of hydraulic fracturing, geothermal stimulation, and refrac diagnostics.

🔹 Presentation Title:
Waterless Fracture Stimulation by Pulsed Power Plasma Using Nanoparticles: Experimental Insights from Sedimentary to Granite Geothermal Rocks
Authors: S. Nguyen, M. Y. Soliman, M. E. El-Tayeb, M. Adel Gabry, M. Myers (University of Houston)

Overview:
Son Nguyen will present experimental results on a waterless fracture stimulation technique using pulsed power plasma and nanoparticles, covering both sedimentary and granite geothermal rocks. This pioneering work explores environmentally friendly fracture initiation methods and lays groundwork for next-generation stimulation technologies.


2. Mohamed Gabry — Thu, February 5, 2026

Session: Complex Geomechanics and Hydraulic Fracture Interactions in Unconventional Developments
Time: 8:30 AM – 11:50 AM CST
Location: Waterway Ballroom 5-8
Session Focus: Advanced geomechanics challenges and fracture interaction phenomena shaping unconventional resource development.

🔹 Presentation Title:
Impact of Relative Stress Magnitudes and Well Orientation on Well Productivity Across Major U.S. Shale Plays: A Regional Data Analysis Study
Authors: M. A. Gabry, M. Soliman , A. Ramadan (University of Houston)

Overview:
Mohamed Gabry will present a data-driven analysis of how stress magnitudes and lateral well orientation influence well productivity across major U.S. shale plays. The study leverages regional analytics to provide actionable insights into design and planning decisions in heterogeneous stress environments.


📍 Conference Details

  • Event: 2026 SPE Hydraulic Fracturing Technology Conference and Exhibition (HFTC)

  • Dates: February 3–5, 2026

  • Venue: Waterway Marriott Hotel & Convention Center, 1601 Lake Robbins Dr, The Woodlands, TX 77380

  • Focus: Hydraulic fracturing innovations, geomechanics, stimulation engineering, diagnostics, and real-world case studies

  • Organized by: Society of Petroleum Engineers (SPE)


🎓 We look forward to seeing you at these technical sessions and celebrating the impactful contributions from the Fracwave research group at HFTC 2026. If you are planning to attend, be sure to mark your calendar!

Unlocking Stimulation in Hard Rock: Nanoparticle Plasma Shockwaves Offer a New Pathway Beyond Hydraulic Fracturing

Posted on: November 20th, 2025 by Mohamed Abdelsalam

By Son Nguyen
Based on Inducing Interconnected Fractures in Granite via Pulsed Power Plasma Using Nanoparticles

A New Direction for Subsurface Stimulation

For more than two decades, hydraulic fracturing has defined unconventional development. Its operational envelope, however, has always relied on the same fundamentals—large water volumes, high-rate pumping, proppant transport, and maintained pressure over long durations. These requirements become limiting outside traditional sedimentary reservoirs, especially in crystalline formations where fracture initiation and propagation demand extreme pressures that fluids cannot reliably sustain.

A recently published study from the University of Houston proposes a fundamentally different approach to rock stimulation—one that does not depend on water injection or surface horsepower. The technique, Nanoparticle-Enhanced Pulsed Power Plasma Stimulation (NP-3PS), uses high-voltage electrical discharges and aluminum nanoparticles to generate ultrafast plasma shockwaves capable of fracturing granite.

While developed for Enhanced Geothermal Systems (EGS), the technology presents stimulation concepts with direct relevance to the petroleum sector, especially in hard-rock intervals, depleted formations, or environments where water sourcing and pumping logistics are prohibitive.

From Sustained Pressure to Microsecond Shockwaves

Conventional hydraulic fracturing loads the formation slowly, building pressure over minutes. In tight crystalline rock, leakoff, thermally degraded fluids, and stress concentrations often limit fracture height and length. NP-3PS approaches stimulation from the opposite direction.

A capacitor bank—charged to as high as 40 kV—discharges into a small borehole filled with a conductive nanoparticle slurry. Within microseconds, the electrical breakdown generates a plasma arc and triggers ignitions of 60–80 nm aluminum nanoparticles. These ignitions behave like distributed thermite reactions inside the fluid column, amplifying the plasma channel and creating multiple sequential shockwaves exceeding 100,000 psi (690 MPa).

Unlike traditional electrohydraulic fracturing, which produces a single arc event, the nanoparticles enable multi-cycle plasma activity, extending the shockwave duration and delivering several discrete energy pulses without tool retrieval or wire replacement.

This sequence of high-intensity, high-frequency impulses fundamentally changes how rock fails. Instead of the classic bi-wing fracture geometry associated with hydraulic fracturing, NP-3PS produces:

  • Radial tensile fractures

  • Oblique and mixed-mode failures

  • Dense microcracking along mineral boundaries

  • Interconnected, tortuous pathways favorable for fluid circulation

These characteristics were validated using 13-µm micro-CT, thin-section analysis, acoustic velocity measurements, and full-cube geomechanical characterization.

Fracturing Granite—Not Just Initiating Cracks

One of the strongest outcomes of the study is its demonstration of full-scale fracture networks in 8-inch (20.3 cm) granite cubes, a material with unconfined compressive strength exceeding 70 MPa. Using an optimized NP-3PS fluid (0.3 wt% aluminum nanoparticles in 7 wt% KCl + 0.18 wt% guar), discharges between 10 and 16 kJ produced fractures that propagated:

  • 6–8 inches radially from the borehole,

  • Through the full cube height, and

  • With measurable apertures of 100–300 µm.

Micro-CT reconstructions revealed a single dominant fracture plane with multiple offshoots, characterized by connectivity indices above 0.8—sufficient to support geothermal circulation or fluid flow in petroleum applications.

Thin-section petrography showed 5–7× increases in grain-scale crack density relative to baseline material, with no mineral melting or thermal alteration, indicating that the mechanism is mechanical rather than thermally destructive.

The stimulated cores exhibited:

  • Porosity increases from 1.3% to as high as 4.6%

  • Thermal conductivity reductions up to 16%

  • Elastic modulus reductions between 11–19%

These are significant property shifts in a rock type traditionally considered unresponsive to stimulation.

Energy Efficiency and Operational Implications

One of the more striking findings of the research is the extremely low energy requirement relative to hydraulic stimulation. The NP-3PS system used individual pulses of 10–16 kJ (0.0028–0.0044 kWh). When normalized to stimulated volume, the effective energy intensity ranged between 5 and 20 kWh per m³ of rock.

For comparison, hydraulic stimulation in field-scale EGS projects requires 10,000–45,000 kWh per m³ of stimulated volume.

Although NP-3PS is not a drop-in replacement for hydraulic fracturing in conventional shale plays, its energy footprint suggests a practical route for stimulating deep, hot, or hard-rock formations where conventional fluids are ineffective.

Operationally, the technology eliminates the need for:

  • Water sourcing

  • High-horsepower surface fleets

  • Proppant transport

  • Wellsite logistics associated with large-volume treatments

For petroleum engineers working in high-temperature carbonates, basement plays, or intervals where conventional stimulation is limited, NP-3PS represents an emerging mechanical stimulation concept with the potential for zonal targeting, reduced seismicity, and minimized environmental impact.

Implications for EGS and Petroleum Engineering

While NP-3PS is targeted initially at geothermal reservoirs, its broader engineering principles align well with ongoing industry trends:

  • Waterless stimulation approaches in water-scarce basins

  • Lower-emission stimulation aligned with ESG objectives

  • Mechanical rather than hydraulic energy delivery

  • Localized, low-seismicity fracturing

For upstream operators, the most immediate applications could include:

  • Hard-rock reservoirs (basement, volcanics, carbonates)

  • Depleted intervals where fracture pressure can no longer be sustained

  • High-temperature wells where fluids degrade rapidly

  • Offshore environments with severe water-handling constraints

A Platform for the Next Generation of Stimulation Technology

The study demonstrates that controlled plasma shockwaves—enhanced by nanoscale energetic materials—can reliably fracture granite under confining stress, create persistent permeability pathways, and significantly alter petrophysical properties in ways beneficial for subsurface flow.

Much like the early days of hydraulic fracturing, NP-3PS is at the experimental stage, but the research provides the first quantitative framework linking plasma physics, nanomaterials, mechanical damage evolution, and reservoir property changes.

The authors conclude that NP-3PS is not intended to replace hydraulic fracturing in shale reservoirs. Instead, it offers a complementary pathway—especially in formations where conventional fluids face fundamental limitations. As geothermal and petroleum deep-rock development expand, the ability to stimulate hard rock efficiently and with minimal environmental impact becomes increasingly valuable.

For petroleum engineers accustomed to traditional fracturing concepts, NP-3PS represents a paradigm shift: stimulation driven by electrical energy, plasma dynamics, and shockwave mechanics, rather than fluid pressure alone.

If the technology scales, it could open access to reservoirs previously considered unstimulateable—and redefine the energy cost, water footprint, and physical mechanisms that underpin subsurface completions.

From Hydraulic Fracturing to Plasma Pulse Stimulation: Rethinking Well Stimulation for Enhanced Geothermal Systems

Posted on: November 17th, 2025 by Mohamed Abdelsalam

Introduction: The Stimulation Challenge at the Heart of Geothermal Expansion

The pursuit of sustainable baseload energy has renewed global attention toward geothermal systems—specifically Enhanced Geothermal Systems (EGS), which aim to transform hot, impermeable rock formations into productive heat exchangers. Unlike conventional hydrothermal reservoirs, where natural permeability supports fluid circulation, EGS relies on engineered fracture networks created through well stimulation.

This requirement—creating and sustaining sufficient permeability under extreme stress and temperature—has emerged as the principal obstacle to commercial deployment. Stimulation governs both the thermal performance and the economic viability of EGS projects. Despite advances in drilling, geomechanics, and real-time monitoring, the fundamental physics of hydraulic stimulation in crystalline basement rock remain limiting.

Traditional methods adapted from oil and gas—hydraulic fracturing, acidizing, and chemical stimulation—struggle to perform under high-temperature and high-stress regimes. The injected fluids can react with minerals, scale fractures, or dissipate through leak-off, while the sustained pressure injection carries risks of induced seismicity. Moreover, EGS projects must meet far more stringent safety and environmental expectations than conventional stimulation operations.

To unlock the full potential of geothermal energy, the industry must rethink how permeability is created. One promising innovation gaining attention is Nanoparticle-Enhanced Plasma Pulse Stimulation (PPPS), a hybrid electro-mechanical method developed by the FracWave Research Group at the University of Houston. Early results indicate that PPPS could alleviate several core challenges in EGS by substituting fluid-driven pressure with precisely controlled electrical discharges.


EGS Stimulation: Persistent Challenges in the Subsurface

1. Subsurface Uncertainty and Limited Connectivity

The fundamental difficulty in EGS stimulation lies in predicting how induced fractures propagate and interconnect between injection and production wells. Crystalline basement formations—granites, gneisses, and metamorphic rocks—possess limited pre-existing permeability. When high-pressure fluid is injected, it tends to reactivate pre-existing joints or faults rather than form new fractures.

Field experience from European and US projects demonstrates that fracture propagation is highly anisotropic and sensitive to local heterogeneity. At the Soultz-sous-Forêts site in France, hydraulic stimulation achieved measurable permeability gains, but fracture growth followed complex natural fault planes, limiting connectivity. The Utah FORGE project has since advanced understanding of stress anisotropy and fracture network evolution, yet results continue to show that the stimulated volume is typically smaller and less connected than models predict (WGC, 2020).

Numerical simulators—whether based on discrete-fracture networks (DFN) or coupled thermo-hydro-mechanical (THM) frameworks—remain constrained by uncertain input parameters. Fracture toughness, in-situ stress orientation, and rock anisotropy often vary by orders of magnitude across short distances. Even with advanced modeling, stimulation outcomes are difficult to forecast.

2. Well Integrity and Material Durability

Geothermal wells must endure conditions rarely encountered in hydrocarbon systems: temperatures exceeding 250 °C, pressure fluctuations during stimulation and production, and chemically aggressive fluids rich in dissolved minerals. Conventional cements and steel grades degrade under cyclic thermal stress, leading to micro-annuli formation, casing deformation, or corrosion.

Failures in well integrity not only jeopardize zonal isolation but can terminate entire projects. Once compromised, geothermal wells are extremely expensive to remediate because of depth and heat. Consequently, the stimulation technique must minimize long-duration stress on well materials and avoid the use of reactive chemicals that could exacerbate corrosion or scaling.

3. Induced Seismicity and Operational Risk

No technical issue has affected public perception of EGS more than induced seismicity. At Basel, Switzerland (2006), fluid injection triggered events up to magnitude 3.4, forcing permanent project closure. In Pohang, South Korea (2017), the correlation between stimulation and a magnitude 5.5 earthquake further heightened global scrutiny.

While modern “traffic-light” monitoring systems have improved safety, they constrain injection rates and volumes, often reducing the ability to create large connected fracture networks. EGS operators must navigate a narrow operational window—high enough pressure to induce fractures, yet low enough to avoid triggering seismic slip on existing faults.

Moreover, the public risk tolerance for seismic events in renewable projects is far lower than in oil and gas. The challenge, therefore, is not simply technical—it is societal. Achieving both effective permeability enhancement and seismic safety requires stimulation methods that minimize sustained pore-pressure buildup and fault activation potential.

4. Water and Chemical Use

Typical EGS stimulation campaigns can consume tens of thousands of cubic meters of water. In arid or remote regions, this requirement poses logistical and environmental constraints. Additionally, at high temperature, injected water interacts chemically with formation minerals, leading to silica or carbonate scaling that reduces permeability over time.

Chemical stimulation methods—acidizing or chelating agents—aim to dissolve obstructive minerals, but reaction kinetics under geothermal conditions are difficult to control. The risk of near-wellbore damage, corrosion, or rapid reaction remains high. A truly sustainable stimulation approach should minimize water and chemical use while maintaining long-term formation stability.

5. Economic Viability

Even with technical success, the economics of EGS remain challenging. Deep drilling, specialized completions, and extended operational timelines contribute to high capital expenditures. Because stimulation outcomes are uncertain, financial risk is significant. A stimulation method that offers predictability, reduced water logistics, and minimal surface infrastructure could meaningfully alter the cost equation.


The Concept of Nanoparticle-Enhanced Plasma Pulse Stimulation (PPPS)

Nanoparticle-Enhanced Plasma Pulse Stimulation proposes a fundamentally different approach to permeability creation—replacing hydraulic energy with controlled electrical energy. The method relies on discharging stored electrical power from surface capacitor banks through coiled-tubing-deployed electrodes inside the wellbore.

A small volume of conductive nanoparticle fluid acts as the transmission medium. When discharged, the plasma forms within the fluid in microseconds, converting electrical energy into a mechanical shock wave that propagates radially into the surrounding rock. Each pulse generates transient pressures that can exceed 100,000 psi for microseconds—sufficient to fracture or reopen sealed natural fractures without the need for continuous hydraulic pressurization.

Between discharges, the well remains at hydrostatic pressure, which minimizes sustained stress loading on the casing and formation. The process is staged and modular: operators can target specific intervals, adjust discharge energy, and repeat the sequence as needed.

Nanoparticles within the fluid improve conductivity, stabilize plasma generation, and enhance the mechanical coupling between the discharge and rock. Laboratory results suggest that nanoparticles may also influence microfracture propagation by modifying interfacial energy at grain boundaries, potentially producing more distributed fracture networks (FracWave, 2025).


How PPPS Addresses Core EGS Challenges

Localized Energy, Global Impact

Unlike hydraulic fracturing, where energy dissipates gradually over large volumes of fluid, PPPS releases energy instantaneously and locally. Each plasma pulse acts as a discrete event, inducing tensile and shear stresses within the near-wellbore region. Repeated pulses can progressively extend the fracture network outward, forming an interconnected system without requiring large-scale fluid movement.

This localized, pulsed energy delivery allows for more precise control over stimulation geometry. Because the pulses are short in duration, the pressure front decays rapidly, reducing the risk of distant fault activation. The ability to direct and sequence pulses along the wellbore offers operators a level of adaptability not available in conventional methods.

Lower Seismic Risk Through Pressure Transience

Induced seismicity in conventional EGS arises largely from prolonged fluid injection, which elevates pore pressure across broad regions of the formation. PPPS operates differently: the pressure perturbation is sharp but transient, and the cumulative pore-pressure increase is minimal.

Theoretically, this minimizes the potential for fault slip at large offsets from the wellbore. Microseismic monitoring during laboratory tests indicates that plasma-induced events are of low magnitude and confined near the wellbore. While full-scale field validation remains ongoing, the pressure-transient character of PPPS aligns well with the seismic safety demands of EGS operations.

Enhanced Permeability and Network Complexity

The shock waves generated by plasma pulses propagate radially, inducing a network of microfractures that may intersect natural discontinuities. Over multiple pulses, these fractures can coalesce into a complex, multi-directional network—precisely the configuration desired in EGS for efficient heat extraction.

The process can be tailored by controlling pulse amplitude, repetition frequency, and duration, allowing the fracture geometry to be tuned to local stress conditions. Because PPPS does not depend on proppant placement, the created fractures rely on asperity support and self-propping under residual stress conditions, similar to shear-dominated dilation observed in some natural systems.

Well Integrity Preservation

Continuous high-pressure injection exerts sustained mechanical loads on casing and cement, promoting deformation and debonding. PPPS, in contrast, delivers very short impulses that dissipate quickly. The absence of extended pressure exposure reduces fatigue on well components.

Furthermore, the nanoparticle fluid is chemically inert and compatible with geothermal well materials. This eliminates corrosion risk associated with acids or high-salinity brines and reduces scaling tendencies. The stimulation therefore imposes minimal chemical or mechanical stress on well infrastructure—a key consideration for long-term EGS operations.

Minimal Water and Chemical Footprint

Because PPPS uses only small fluid volumes for electrical conduction, its water footprint is orders of magnitude lower than hydraulic stimulation. This makes it particularly suited for geothermal fields in arid regions or areas where water management imposes regulatory constraints.

The method also avoids chemical additives, surfactants, or proppants, reducing both environmental exposure and supply-chain complexity. From a sustainability perspective, this shift aligns closely with broader industry trends toward low-impact, resource-efficient operations.

Operational Simplicity and Cost Implications

On the surface, PPPS requires only electrical infrastructure—capacitor banks, control systems, and a coiled-tubing unit—eliminating the need for large pump spreads or fluid-handling equipment. The reduced logistical footprint can lower mobilization costs, site emissions, and noise.

If energy-to-fracture coupling efficiency proves high, the operational cost per stimulated interval may decrease substantially. However, early deployment will likely carry a premium due to specialized equipment and safety certification requirements. As the technology matures and scales, cost competitiveness with hydraulic methods may be achievable.


Research Progress and Validation Pathways

Although the PPPS concept builds on decades of research in plasma-based rock fracturing and pulsed-power physics, its application to deep geothermal systems is recent. Laboratory studies at the University of Houston have confirmed the formation of multi-directional fracture networks in granite samples under confining stress. Visualization with micro-computed tomography (µCT) revealed distributed microcrack systems extending several centimeters from discharge centers.

Numerical models coupling electromagnetic and mechanical dynamics are under development to simulate energy transfer, fracture initiation, and propagation. These simulations suggest that fracture growth is primarily driven by the rapid thermal expansion of plasma channels and resulting pressure waves, rather than electrical breakdown alone.

Upcoming field-scale pilots aim to test the method in 3–5 km-deep wells at temperatures above 200 °C. Instrumentation will include downhole pressure transducers, distributed acoustic sensing (DAS), and microseismic arrays to quantify the spatial and temporal characteristics of induced fractures. The objectives are to assess fracture geometry, induced seismicity, and injectivity improvement, providing the data necessary to calibrate THM models and refine operational parameters.


Comparative Perspective: Hydraulic vs. Plasma Pulse Stimulation

While hydraulic fracturing and PPPS share the same goal—enhancing subsurface permeability—their operational principles diverge sharply.

Aspect Hydraulic Stimulation Plasma Pulse Stimulation (PPPS)
Energy Source Fluid pressure (mechanical) Electrical discharge (electromechanical)
Medium Water-based fluid, often with additives Conductive nanoparticle suspension
Duration Continuous injection (hours to days) Pulsed discharges (microseconds)
Seismic Potential Moderate-to-high due to sustained pressure Potentially lower due to pressure transience
Water Requirement Very high Minimal
Chemical Usage Common (acids, polymers, surfactants) Minimal to none
Proppant Requirement Yes (for conductivity) None (relying on natural asperities)
Surface Infrastructure Large pump and fluid-handling setup Compact power and control units
Well Integrity Stress Sustained pressure loads Short-duration impulses

This comparison underscores why plasma-based methods may represent a new class of stimulation: one that integrates the controllability of electrical systems with the mechanical impact of shock-wave physics.


Integration with Monitoring and Digital Control

Modern EGS projects rely heavily on high-resolution diagnostics—microseismic arrays, distributed temperature sensing (DTS), and fiber-optic acoustic monitoring. PPPS lends itself naturally to integration with such systems. Each pulse is discrete and timestamped, allowing correlation between discharge energy and microseismic response.

This closed-loop stimulation concept could evolve into an autonomous optimization framework, where real-time monitoring feeds back into the discharge control algorithm. Such integration would align with emerging digital twin architectures for geothermal reservoirs, enabling adaptive stimulation with minimal human intervention.


Remaining Challenges

Despite its promise, PPPS faces several technical and logistical challenges before it can become mainstream.

  1. Scaling Laws: Laboratory results must be extrapolated to field scale. The interaction between shock waves and large-scale heterogeneities in natural rock remains poorly understood.
  2. Regulatory Framework: Current well stimulation regulations are based on hydraulic methods. New safety and certification standards will be needed for high-voltage downhole operations.

  3. Economic Validation: The cost structure of plasma equipment, power delivery, and operational redundancy will determine whether PPPS can compete commercially once development costs are amortized.


Industry Implications and Outlook

If PPPS delivers on its promise, it could redefine stimulation strategy not only for geothermal systems but also for tight gas, coalbed methane, and carbon storage projects where water or seismic constraints limit hydraulic methods. The potential for cross-sector technology transfer—from petroleum engineering to geothermal energy—is significant.

In the near term, PPPS will likely complement rather than replace hydraulic stimulation. Hybrid workflows—using plasma pulses to precondition rock before low-pressure fluid injection—may offer the best of both worlds: enhanced connectivity with reduced seismic and environmental impact.

The broader implication is philosophical as much as technical. PPPS exemplifies a shift toward electrification of the subsurface, where energy is delivered in controlled, measurable quanta rather than bulk fluids. This aligns with the industry’s move toward digitalization, precision operations, and carbon-conscious engineering.


Conclusion: From Pressure to Precision

Enhanced Geothermal Systems hold the promise of near-unlimited clean energy, but their success depends on overcoming one stubborn challenge—creating reliable, sustainable permeability in hot, impermeable rock. Nanoparticle-Enhanced Plasma Pulse Stimulation represents a significant step toward that goal.

By converting electrical energy into controlled mechanical work, PPPS addresses many of the barriers that have hindered EGS deployment: uncertain fracture growth, induced seismicity, water scarcity, and material degradation. The technology is still in early stages, and robust field validation remains ahead. Yet its conceptual alignment with the physical and environmental constraints of geothermal reservoirs positions it as one of the most intriguing innovations in stimulation science in decades.

As the energy industry evolves, technologies like PPPS highlight the emerging convergence between petroleum and geothermal engineering—where insights from one field accelerate progress in another. The path to a clean, continuous geothermal future may not lie in higher pressures or deeper wells, but in smarter, electrically driven precision stimulation.

Machine Learning Modelling of Subsurface Hydraulic Fracturing

Posted on: October 23rd, 2025 by Mohamed Abdelsalam

From Empirical Practice to Predictive Science: The Role of Hydraulic Fracture Modeling

Hydraulic fracture modeling is central to modern stimulation engineering because it provides the quantitative link between design parameters, rock mechanics, and fluid dynamics that govern fracture propagation, transforming a complex subsurface process into a predictive, physics-based framework. By solving the coupled equations of fluid flow, stress redistribution, and rock failure, the model enables engineers to explore how injection rate, viscosity, proppant concentration, and in-situ stress anisotropy control fracture length, height, width, and conductivity. Practically, it functions as a virtual laboratory where the interplay between fluid and rock can be studied under controlled conditions before field execution, minimizing uncertainty and cost. The typical inputs include mechanical and hydraulic properties of the formation (elastic modulus, Poisson’s ratio, fracture toughness, leak-off coefficients), fluid characteristics (density, viscosity), and operational parameters such as injection rate and stage spacing. The resulting outputs—fracture geometry, net pressure, and proppant distribution-provide not only the basis for treatment optimization but also critical information for reservoir engineers. These parameters are directly implemented in stimulated reservoir volume (SRV) calculations, reservoir simulation models, and production forecasts to quantify the extent and effectiveness of the stimulated region. Thus, hydraulic fracture modeling bridges completion design and reservoir management by converting invisible subsurface processes into quantifiable engineering insights, elevating hydraulic fracturing from an empirical operation to a predictive, data-informed science that underpins both efficiency and long-term reservoir performance.

Physics-Based and Numerical Frameworks for Fracture Simulation

Hydraulic fracture physics-based modeling encompasses a hierarchy of analytical, semi-analytical, and fully numerical approaches, each tailored to the complexity of the formation and the objective of the study. Simplified analytical or pseudo-3D models are often employed in early design stages to rapidly estimate fracture geometry and treatment pressures, offering practical insight into fracture containment and fluid efficiency. In contrast, fully coupled 3D numerical models—such as finite element, boundary element, or discrete fracture network simulations—capture detailed stress redistribution, fracture coalescence, and fluid-solid interaction, providing high-fidelity predictions of fracture complexity and proppant transport. In unconventional shale reservoirs, these models help interpret stage-by-stage performance, optimize cluster spacing, and assess inter-well interference, while in geothermal systems they are used to evaluate heat-extraction efficiency, fracture conductivity evolution, and long-term thermal recovery. Regardless of scale, all modeling frameworks share a common goal: to translate subsurface physics into actionable parameters that guide completion design, reservoir connectivity, and sustainable production. By integrating these modeling tools across disciplines, engineers can bridge the gap between stimulation and reservoir management, ensuring that hydraulic fracturing evolves from a trial-and-error operation into a predictive and continuously improving engineering science.

Challenges and Uncertainties in Linking Pressure to Geometry

Despite its critical role, hydraulic fracture modeling remains one of the most challenging domains in subsurface engineering due to the inherent complexity and uncertainty of the coupled rock–fluid–stress system. The foremost challenge lies in characterizing the heterogeneous reservoir, where natural fractures, bedding planes, and variable stress fields control fracture initiation and propagation yet are only indirectly constrained by limited data. Laboratory-measured mechanical properties rarely capture true in-situ conditions of temperature, pore pressure, and anisotropy, introducing substantial uncertainty into model inputs. A particularly crucial role of modeling is its ability to link treating pressure-one of the few directly measurable field parameters-to fracture geometry and evolution, thereby converting surface observations into subsurface understanding. This connection allows engineers to interpret pressure signatures in terms of fracture growth, containment, and fluid efficiency, forming the foundation for real-time treatment control and post-job evaluation. However, achieving this linkage is inherently difficult because the system couples multiple nonlinear processes—non-Newtonian fluid flow, proppant transport, leak-off into a deforming porous medium, and dynamic fracture propagation-each occurring at vastly different time and spatial scales. Numerical models must reconcile fracture-tip physics at the millimeter scale with field-scale flow dynamics extending hundreds of meters, while maintaining computational stability and physical accuracy. Simplifications such as planar or homogeneous-layer assumptions often sacrifice realism, particularly in unconventional reservoirs where fracture complexity and stress interference dominate behavior. Moreover, validating model predictions remains a persistent obstacle, as the fracture network cannot be directly observed; calibration relies on indirect data that carry their own uncertainties. Consequently, hydraulic fracture modeling is not merely a theoretical construct but a vital interpretive framework-transforming pressure, rate, and injection data into geometric and mechanical insights that drive the next stages of stimulation design, reservoir simulation, and production optimization.

Hydraulic fracturing in unconventional reservoirs operates at an industrial scale characterized by repetitive, high-intensity stimulation campaigns across laterally extensive shale formations with relatively uniform mechanical and petrophysical properties. Because these reservoirs typically exhibit low permeability and high brittleness within a continuous stratigraphic horizon, the design parameters,such as fluid type, injection rate, stage spacing, and proppant concentration,tend to remain consistent across multiple wells and pads, adjusted only for local stress variations or natural fracture intensity. This standardization enables large-scale development but also amplifies the need for accurate modeling to ensure that uniform designs still achieve effective reservoir contact. The complete workflow,from modeling inputs like in-situ stress and rock elastic properties to the final production forecast—faces challenges in uncertainty propagation, as small errors in property estimation can lead to large discrepancies in predicted fracture geometry and drainage efficiency. Consequently, even though unconventional plays follow highly systematic operational practices, the underlying physics remain complex; understanding how each modeled parameter translates into actual fracture behavior and long-term production is essential for sustaining efficiency, consistency, and economic viability across large development programs.

Modern hydraulic fracturing relies on a suite of advanced diagnostic technologies to estimate fracture geometry and monitor stimulation effectiveness. Microseismic monitoring is widely applied in shale and geothermal wells to map fracture propagation in three dimensions, while tiltmeters and fiber-optic distributed sensing (DAS/strain) provide near-wellbore and along-wellbore measurements of deformation, temperature, and strain evolution. Tracer surveys and production logging complement these measurements by revealing post-stimulation fluid connectivity and fracture extent. However, such technologies are typically restricted to research wells, pilot programs, or high-value development areas where cost and logistics justify their deployment. In contrast, treating pressure remains the only universally available and continuously measured dataset for every hydraulic fracture job, serving as the common diagnostic thread across all operations. Because surface pressure is recorded in all treatments, it forms the backbone for integrating and upscaling the insights from high-resolution diagnostics-allowing the relationships between microseismic, fiber-optic, and tracer responses to be generalized across larger well populations thtough usig them as calibration of physics based models. This unified interpretation framework transforms treating pressure from a simple operational metric into a scalable diagnostic proxy that bridges individual high-tech observations with field-wide understanding of fracture geometry, containment, and stimulation efficiency.

Although treating pressure remains the only continuously measured and universally available dataset during hydraulic fracturing, the interpretive frameworks built around it are still limited. The classical Nolte–Smith plot provides a simple and widely used approach to infer fracture propagation and fluid efficiency from net-pressure versus time behavior. Its main advantage lies in its rapid field applicability and its ability to identify basic fracture growth trends, fluid efficiency, and possible height containment effects. However, it requires accurate determination of closure pressure, assumes a fixed reference point (typically at pump start or breakdown), and presumes uniform stress and leak-off conditions—assumptions that often fail in heterogeneous, multi-cluster, or non-planar fracture environments. The Moving Reference Point (MRP) technique was developed as an improvement, dynamically updating the reference time and pressure to better capture pressure fluctuations and detect transitions in fracturing modes such as dilation, containment, or height growth during pumping. MRP’s key advantage is its capacity to track real-time fracture behavior and adapt to changing operational conditions, but it still depends on empirical power-law relationships and requires computational tuning. Like all pressure-based techniques, it lacks direct spatial resolution of fracture geometry, meaning that in complex unconventional reservoirs, its interpretation remains indirect and must be carefully coupled with physics-based understanding or complementary diagnostics for reliable application.Complementing it using machine learning has serious obstacle of relying on physical assumption simplifying the complexity of fracture propagation complexity.

Toward a Unified Pressure-Based Diagnostic Ecosystem

Building upon the limitations of classical treating-pressure diagnostics such as Nolte–Smith and MRP, we introduced a new physics-based framework that extracts the hidden subsurface information embedded in surface pressure data through time–frequency wavelet analysis. In Calibration of CWT for Dynamic Hydraulic Fracture Propagation with Microseismic Data (SPE-217789-MS, 2024), we presented the Continuous Wavelet Transform (CWT) as a novel diagnostic tool capable of linking treating-pressure variations to fracture geometry evolution. By correlating distinct frequency–time energy bands with microseismic event clouds and Moving Reference Point (MRP) diagnostics, we established a physics-based connection between surface pressure and subsurface fracture dynamics. This correlation demonstrated that specific wavelet-energy signatures correspond to identifiable fracture-growth stages-such as early dilation, lateral extension, and vertical containment-enabling qualitative fracture interpretation from treating pressure alone. The calibration process transformed the CWT from a purely visual signal-processing method into a validated diagnostic framework that can track fracture propagation in real time and under field-scale complexity.

We advanced this methodology further in Advanced Deep Learning for Microseismic Event Prediction for Hydraulic Fracture Treatment via CWT (Geoenergy Science & Engineering, 2024), where we introduced the normalized CWT scalogram to enhance feature consistency and interpretability across different wells, stages, and formations. The normalized representation converts the one-dimensional pressure signal into a time–scale energy map that reveals dynamic fracture behavior—such as branching, leak-off transitions, and confinement changes—that are often obscured in conventional time-domain pressure records. We then extended the analysis by training a deep-learning model using CWT-derived features as inputs and microseismic event coordinates as outputs. This approach enabled direct prediction of three-dimensional fracture geometries and microseismic clouds from pressure data alone, establishing the foundation for automated stimulated reservoir volume (SRV) estimation and real-time fracture evaluation.

We later reinforced this framework through integration with fiber-optic distributed sensing, as presented in Hydraulic Fracture Characterization Using CWT for Treating Pressure Calibrated with Fiber Optics (URTeC-4203446-MS, 2025). By synchronizing CWT energy patterns with Distributed Acoustic Sensing (DAS)  data, we verified that the wavelet-derived energy transitions aligned with deformation and temperature anomalies along the wellbore. This cross-calibration validated that surface-based CWT analysis captures the same fracture-activation signatures observed by high-resolution downhole monitoring, extending its diagnostic fidelity to field-scale operations.

We further expanded the machine-learning integration in Estimating SRV from ML-Predicted Microseismic Clouds Using Pressure-Only CWT Features (SPE-228059-MS, 2025), where we applied the trained model to the Boggess-5H well in the Marcellus Shale. The synthetic microseismic clouds and corresponding SRV estimates—computed via convex-hull and Delaunay-triangulation methods—matched closely with field-derived and rate-transient-analysis results, confirming that treating-pressure-based wavelet features can quantitatively reproduce fracture geometry and production performance. This outcome marked a pivotal advancement toward pressure-only fracture diagnostics that combine physics and data science in one consistent workflow confirming scaleability of our deep learning model to be generalized all over the same basin.

In Advanced Fracture Diagnostics in Utah FORGE EGS: Integrating CWT, Microseismic, and Fiber-Optic Data (SPE-228063-MS, 2025), we applied our previously developed CWT-based fracture diagnostic framework to the unique thermo-mechanical environment of an Enhanced Geothermal System (EGS). The focus was not on the field site itself but on validating our methodology’s universality—whether the same physics-informed signal-analysis principles that capture hydraulic fracture propagation in shale could quantify fracture evolution in crystalline geothermal rock. We adapted the CWT workflow to process treating-pressure data from injection stages, linking wavelet-energy patterns to microseismic activation sequences and fiber-optic strain/temperature anomalies.

Our framework demonstrated that pressure-derived CWT scalograms could identify key fracture processes-initiation, branching, containment, and closure- even under high-temperature, low-permeability conditions. The time-localized energy clusters in the wavelet domain correlated with bursts in microseismic activity and strain fronts detected along the monitoring wells, proving that the dynamic frequency content of the pressure signal carries a quantifiable imprint of the evolving fracture network. Additionally, we incorporated water-hammer damping analysis into the wavelet energy field, showing that higher damping rates correspond to greater fracture complexity, consistent with both fiber-optic strain gradients and distributed temperature drops during injection.

By cross-validating these independent observables within a single analytical space, we established a multi-physics data-fusion framework where the treating-pressure CWT served as the temporal backbone, and the microseismic and fiber-optic data provided spatial calibration. The result is a fully interpretable system capable of mapping Activated Reservoir Volume (ARV), quantifying network complexity, and diagnosing containment without relying on high-cost downhole imaging.Our work showed that CWT-based pressure diagnostics are not only transferable but scalable-offering a single, unified methodology for understanding stimulation physics across petroleum and geothermal systems alike.

Through these collective developments, we established a unified pressure-based diagnostic and predictive ecosystem that bridges analytical modeling, field data, and machine learning. This framework enables quantitative estimation of fracture geometry, SRV, and microseismic distribution from treating pressure alone, transforming the most accessible operational signal into a high-resolution subsurface diagnostic. It represents a decisive shift toward intelligent, data-driven stimulation design—bridging the gap between physics, diagnostics, and predictive modeling in both unconventional and geothermal energy systems.


Seeing Fracture Propagation Through Treating Pressure, Calibrated Using Distributed Fiber Optics Data

Posted on: September 25th, 2025 by Mohamed Abdelsalam

Moving Beyond Conventional Pressure Diagnostics

The accurate identification of fracture events is one of the most critical — and most challenging — aspects of hydraulic fracturing. Nolte–Smith plots, long the standard for treating pressure interpretation, assume continuous fracture growth from a single initiation point. Field and experimental evidence, however, shows that fracture propagation is intermittent, with alternating periods of dilation, extension, and interaction with natural features.

To capture this complexity, the FracWave Research Group at the University of Houston developed the normalized Continuous Wavelet Transform (CWT) scalogram. Instead of relying on smoothed or averaged pressure curves, the CWT decomposes treating pressure into fine-scale, time–frequency features. The result is a high-resolution map that directly displays fracture propagation signatures as they evolve during pumping.

What the Scalogram Shows

The normalized CWT scalogram turns bottomhole pressure into a color-coded diagnostic that distinctly separates fracture behaviors:

  • Green “flames” (normalized coefficients 0.4–0.6): signature of lateral fracture length propagation.

  • Red zones (0.8–0.95): indicators of vertical fracture growth or strong fluid diversion into high leak-off intervals.

  • Blue areas (0.0–0.25): regions of limited fracture width development, often linked to near-wellbore complexity.

This framework allows fracture propagation modes to be seen directly in treating pressure, without requiring specialized monitoring hardware.

Validation Against Fiber Optics

To verify that these pressure-based signatures represent actual fracture behavior, the method was calibrated against Distributed Fiber Optic Sensing (DFOS) measurements from the Marcellus Shale Energy and Environment Laboratory (MSEEL).

Across multiple stages of the Boggess-5H well, strong alignment was observed:

  • Stage 41: Early red-dominated scalogram regions corresponded to limited propagation, matching weak DFOS strain activity. As green patterns emerged, DFOS simultaneously recorded tensile strain bands along the well, confirming fracture tip extension. Later red bursts in the scalogram matched localized DFOS strain spikes, indicating vertical growth or interaction with high leak-off pathways.

  • Stage 26: Sustained green scalogram zones reflected dominant lateral propagation across clusters. DFOS strain maps showed consistent extension, while intermittent red spikes coincided with fracture activation events.

  • Stage 4: Alternating green and red patterns revealed shifts between fracture length growth and episodes of fluid diversion. DFOS data confirmed these transitions, capturing strain intensifications at the same moments highlighted by the scalogram.

This side-by-side calibration confirmed that fracture propagation signatures are embedded in treating pressure and can be reliably extracted through normalized CWT analysis.

Figures at a Glance

Figure 1. Normalized CWT scalogram of treating pressure compared with DFOS strain response in Boggess-5H Stage 26. 

Figure 2. Normalized CWT scalogram of treating pressure compared with DFOS strain response in Boggess-5H Stage 41. 

Figure 3. Normalized CWT scalogram of treating pressure compared with DFOS strain response in Boggess-5H Stage 4. 

Value to the Industry

The significance of this work lies in its practicality:

  • We can now see fracture propagation modes directly on treating pressure — a signal that is already recorded in every frac job.

  • No special hardware is required. Unlike microseismic or fiber deployments, this method relies only on standard treating pressure measurements.

  • Real-time visibility. Fracture behavior can be tracked while pumping is ongoing.

  • Scalable and cost-effective. Applicable to every stage in every well, not just pilots.

By transforming pressure into a diagnostic canvas, the normalized CWT scalogram makes high-resolution fracture diagnostics accessible for routine operations.

Looking Forward

Building on this foundation, the FracWave team has also demonstrated that CWT scalograms can feed machine learning models to predict three-dimensional microseismic event clouds from pressure alone. With validation against both DFOS and microseismic, this creates a path toward fully automated, low-cost fracture monitoring and optimization.

Conclusion

The normalized CWT scalogram reveals what was previously hidden: the dynamic signatures of fracture propagation embedded in treating pressure. Distinct color patterns correspond to lateral extension, vertical growth, and limited width development. These interpretations, validated by fiber-optic strain data from the Marcellus Shale, demonstrate that treating pressure is not just an operational record — it is a powerful real-time diagnostic tool.

Reference

Gabry, M. A., Ramadan, A., and Soliman, M. Y. 2025. Hydraulic Fracture Characterization Using Continuous Wavelet Transform for Treating Pressure, Calibrated with Fiber Optics Data. URTeC 4203446, Houston, Texas.

Watch this video for more details

Advancing Fracture Closure Detection: Continuous Wavelet Transform (CWT) Technique and Its Calibrations

Posted on: September 23rd, 2025 by Mohamed Abdelsalam

Introduction

Fracture closure detection has long been one of the most debated topics in petroleum and geothermal engineering. Determining minimum horizontal stress (Shmin) is essential for fracture design, reservoir management, and geomechanical modeling. Conventional approaches, such as the Nolte G-function, tangent method, and compliance method, rely on simplifying assumptions that often break down in unconventional reservoirs where fracture networks are complex and heterogeneous.

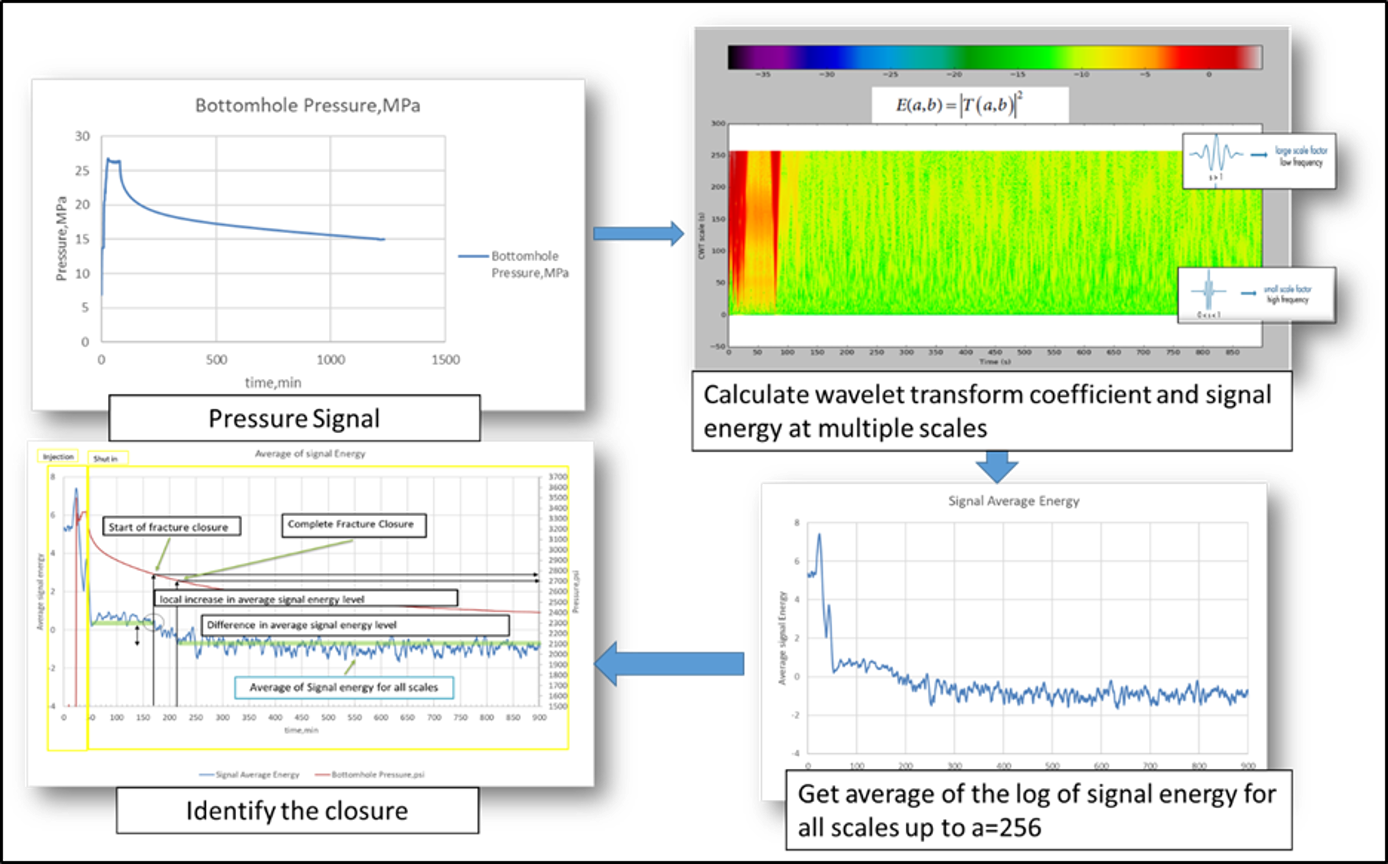
To overcome these challenges, we developed a novel fracture closure detection method based on the Continuous Wavelet Transform (CWT). Unlike traditional techniques, the CWT approach does not rely on pre-set assumptions about fracture geometry, stiffness, or leak-off behavior. Instead, it analyzes the pressure falloff signal in the time–frequency domain to identify fracture closure more robustly. This article summarizes the theoretical basis of the technique, its calibration through laboratory experiments, validation using field data, and its overall integration into modern workflows.

Theoretical Development of the CWT Technique

The foundation of the CWT method was established to address limitations in G-function derivatives and compliance analysis. By decomposing the pressure falloff signal into multiple frequency scales using the Morlet wavelet, CWT provides a “mathematical microscope” for identifying closure. Closure is marked by a distinct peak in wavelet energy followed by stabilization at a lower level.

Key advantages of this theoretical framework include:

  • Independence from assumptions about fracture stiffness evolution or Carter leak-off models.

  • Sensitivity to dynamic fracture behavior, including sequential closures in naturally fractured formations.

  • Ability to distinguish closure signals from noise, which is especially valuable in field applications.

Theoretical modeling using synthetic pressure data and flow regime simulations confirmed that the CWT method consistently detected closure pressure more accurately than tangent or compliance methods.

CWT Fracture Closure Detection Technique Workflow

CWT Fracture Closure Detection Technique Criteria

Laboratory Calibration

Controlled laboratory experiments under true-triaxial conditions provided the first systematic calibration of the CWT technique. Samples of granite and sandstone were fractured under known minimum stress conditions, followed by pressure falloff cycles.

The results demonstrated that:

  • CWT estimates of closure pressure consistently matched applied stress within about 5 percent.

  • The method remained robust across rock types with different permeability and surface roughness.

  • CWT resolved sequential closure events associated with natural fracture interactions, while tangent and compliance methods systematically underestimated stress.

These laboratory calibrations confirmed the technique’s accuracy and adaptability to different geomechanical settings.

Field Calibration with SIMFIP Measurements

The next stage of validation used field-scale data from the EGS Collab project, where fracture closure was directly measured with the SIMFIP tool. This probe records micron-level borehole deformation during fracture opening and closure, providing an independent benchmark.

CWT-based closure detection aligned closely with SIMFIP-derived stress values. The method also recognized complex closure behavior, including the influence of natural fractures and rough fracture faces. By comparison, conventional methods often produced inconsistent or underestimated values. The successful field calibration demonstrated that CWT can serve as a reliable tool in both geothermal and petroleum reservoirs, where stress estimation accuracy is critical.

Field calibration setup for CWT fracture closure detection technique.

Comparison between fracture closure using the new technique and measured fracture closure using SIMFIP tool

Integration and Comprehensive Review

A broader review of closure detection methods highlighted the limitations of conventional techniques. The tangent method tends to identify closure too early under nonlinear leak-off, while the compliance method often fails to provide consistent signatures in naturally fractured reservoirs.

By contrast, CWT functions as an assumption-free technique that can arbitrate between tangent and compliance interpretations. This enables a more reliable workflow for closure detection, improving confidence in stress estimation across diverse reservoir types.

Implications for Industry

The introduction and calibration of CWT fracture closure detection carry major implications for subsurface engineering:

  • Improved fracture design from more accurate stress profiles.

  • Reduced uncertainty in geomechanical models.

  • Applicability across oil, gas, geothermal, and carbon storage projects.

  • Integration into DFIT workflows as a benchmark method that reconciles discrepancies between existing techniques.

The CWT technique provides a universal and validated approach to fracture closure detection, enhancing both academic research and field operations.

For more details

  • Gabry, M.A., Eltaleb, I., Ramadan, A., Rezaei, A., Soliman, M.Y. Hydraulic Fracture Closure Detection Techniques: A Comprehensive Review. Energies, 2024. DOI: 10.3390/en17174470
  • Gabry, M.A., Eltaleb, I., Soliman, M.Y., Farouq-Ali, S.M. A New Technique for Estimating Stress From Fracture Injection Tests Using Continuous Wavelet Transform. 2022. https://doi.org/10.3390/en16020764
  • Gabry, M.A., Eltaleb, I., Soliman, M.Y., Farouq-Ali, S.M., Cook, P.J., Soom, F.A., Guglielmi, Y. Validation of Estimating Stress from Fracture Injection Tests Using Continuous Wavelet Transform With Experimental Data. 2022. https://doi.org/10.3390/en16062807
  • Gabry, M.A., Ye, Z., Ramadan, A., Ghassemi, A., Soliman, M.Y. Calibration of Continuous Wavelet Transform (CWT) Fracture Closure Detection Using Laboratory Hydraulic Fracturing Experiments. URTeC 4221618

Advancing Hydraulic Fracture Diagnostics with the Moving Reference Point (MRP) Technique

Posted on: September 9th, 2025 by Mohamed Abdelsalam

Hydraulic fracturing is a cornerstone technology for enhancing hydrocarbon recovery from unconventional and tight formations. Successful fracture treatments depend critically on understanding the real-time behavior of the fracture as it propagates through the reservoir. Among the many diagnostic tools developed for fracturing analysis, pressure data measured during fracturing remains the most accessible and valuable source of information.

Traditionally, the Nolte-Smith technique has been the industry-standard method for interpreting fracturing pressure-time data. However, despite its wide use and theoretical foundation, this method operates under assumptions and limitations that can delay or obscure critical insight about fracture growth and behavior. To address these challenges, the Moving Reference Point (MRP) technique was developed, significantly improving real-time diagnostic capability and providing a more precise, faster, and less assumption-laden approach.

This article reviews the development, theoretical basis, practical implementation, and application of the MRP technique to hydraulic fracturing pressure data interpretation. Multiple field examples and case studies are discussed to illustrate its advantages over traditional methods and its integration with advanced fracture simulators.

Background: Conventional Fracture Pressure Interpretation and Its Limitations

The conventional approach, represented primarily by the Nolte-Smith (1981) method, uses a log-log plot of net fracturing pressure (pressure above formation closure stress) versus time to categorize fracture propagation into four distinct modes. These modes represent typical fracturing behavior such as normal fracture extension, screenouts, height growth, and critical pressure behavior. While theoretically sound and validated for many treatments, this approach hinges on key assumptions:

  • Constant injection rate during fracturing.

  • Continuous and smooth fracture propagation over time.

  • Accurate knowledge of formation closure pressure to compute net pressure.

  • Use of a log-log scale which compresses data and reduces sensitivity to rapid or subtle changes.

In real life, especially with complex shale and naturally fractured formations, these assumptions frequently break down. Fracture growth often occurs intermittently, with periods of ballooning or dilation interspersed with propagation spurts. This can cause delayed detection of important events, such as screenouts or fracture height growth, because the constant initial reference time compresses the temporal resolution of changes on the log-log plot. Moreover, closure pressure is often uncertain or varies between stages, making net pressure difficult to establish precisely in real time.

The pressure-derivative technique, introduced by Ayoub et al. (1992), enhanced sensitivity by plotting the time-derivative of pressure multiplied by time on a log-log scale, sharing the slope with the original log-log plot. However, it retains the dependency on closure pressure and assumptions of smooth fracture growth, still limiting its real-time application.

The Moving Reference Point Concept: Foundational Innovation

The Moving Reference Point (MRP) technique, introduced by Pirayesh et al. (2013), was developed to overcome these limitations by fundamentally altering the reference framework used to examine fracturing pressure data. Instead of referencing all fracturing events to the initial injection time and closure pressure (fixed reference), MRP dynamically updates the reference time and pressure point when fracturing behavior changes.

This approach reflects and accommodates the observation that fractures do not grow continuously but undergo cycles of propagation, dilation (ballooning), and height growth. Each of these phases can be better identified by shifting the reference point to the onset of that phase rather than rigidly linking all data to treatment start time.

The MRP technique employs a power-law relationship linking pressure and time relative to the current reference point. From this, an exponent e describing fracturing behavior is computed continuously over time. This exponent is the central diagnostic parameter allowing classification of fracturing events:

  •  indicates normal fracture extension.

  •  signifies dilation due to low fracture growth rate (ballooning).

  •  indicates rapid height growth or excessive fluid leak-off.

This flexible, shifting-frame analysis allows rapid detection of changes in fracturing behavior within seconds to a few minutes of their onset, compared to the tens of minutes lag encountered in the Nolte-Smith approach.

Workflow for the Moving reference point technique

Example of MRP Plot

Numerical Implementation and Workflow

The interpretation workflow begins by selecting an initial reference time and pressure point after formation breakdown or fracture reopening, omitting early noisy data. From there, the technique proceeds sequentially through time, calculating the exponent  for each new point relative to the current reference.

When the mismatch between the estimated bottomhole pressure (calculated from e and other parameters) and the observed wellbore pressure exceeds a predefined threshold, the reference point is shifted to this new time and pressure, resetting the sliding window of analysis. This computationally intensive procedure requires computer programming, but yields a smooth, updated profile of e(t) over the treatment duration.

Plotting  versus time on a Cartesian graph provides a visually intuitive interpretation of changing fracturing modes without data compression. Peaks and troughs on this graph correspond to ballooning, propagation, or height growth phases.

Broader Applications and Advances

Following successful initial demonstrations, MRP has been applied across diverse formations, including complex heterogenous and naturally fractured systems such as the Cotton Valley and Travis Peak sandstones in East Texas.

Studies incorporating MRP with integrated fracture simulators, like the GOHFER planar 3D model, enable:

  • Calibration of fracture treatments against detailed reservoir petrophysical and geomechanical data.

  • Comparison of fracture events detected by MRP with synthetic simulation fracture growth, height propagation, and leak-off cycles.

  • Improved understanding of fluid efficiency and fracture complexity, guiding modifications in pumping rate, fluid properties, and proppant schedules to avoid sanding out or delivery inefficiencies.

These integrated approaches extend MRP’s utility from diagnostic interpretation to a key element in decision-making workflows for optimizing hydraulic fracturing design and execution.

Recommendations for Practice

  • Use downhole pressure gauges to capture accurate, high-frequency pressure data necessary for MRP’s detailed temporal resolution.

  • Apply MRP analysis in real time during fracturing treatments to detect events early and adjust parameters—pumping rate, fluid viscosity, proppant concentration—to prevent adverse outcomes like screenouts and excessive height growth.

  • Combine MRP results with microseismic monitoring and hydraulic fracture simulation outputs to triangulate fracture geometry and propagation mode more confidently.

  • Continuously calibrate and optimize MRP numerical routines and threshold parameters for field-specific conditions and treatment types.

Conclusion

The Moving Reference Point technique revolutionizes hydraulic fracturing pressure interpretation by introducing a dynamic frame of reference aligned with fracture growth phases. This method addresses key limitations of traditional log-log methods by improving temporal resolution, eliminating dependency on closure pressure knowledge, and accommodating complex, intermittent fracture behavior.

Validated through multiple field cases and enhanced by integration with sophisticated simulation models, MRP supports real-time decision-making that improves treatment efficiency and well performance. As real-time monitoring and digital oilfield capabilities grow, MRP stands as an essential tool for smarter, more adaptive hydraulic fracturing operations.

You can now uplaod your treating pressure and get MRP Curve for your job using the following tool:

You will need time of the pumping period in minutes , downhole (prefered) or surface treating pressure and date/time column for the job during pumping


🚀 Launch MRP Analysis Tool